Two terms that students often get confused in statistics are z-values and p-values.
To understand the difference between these terms, it helps to understand z-tests.
There are two common types of z-tests:
- One-sample z-test: Used to test whether a population mean is equal to some value.
- Two-sample z-test: Used to test whether two population means are equal.
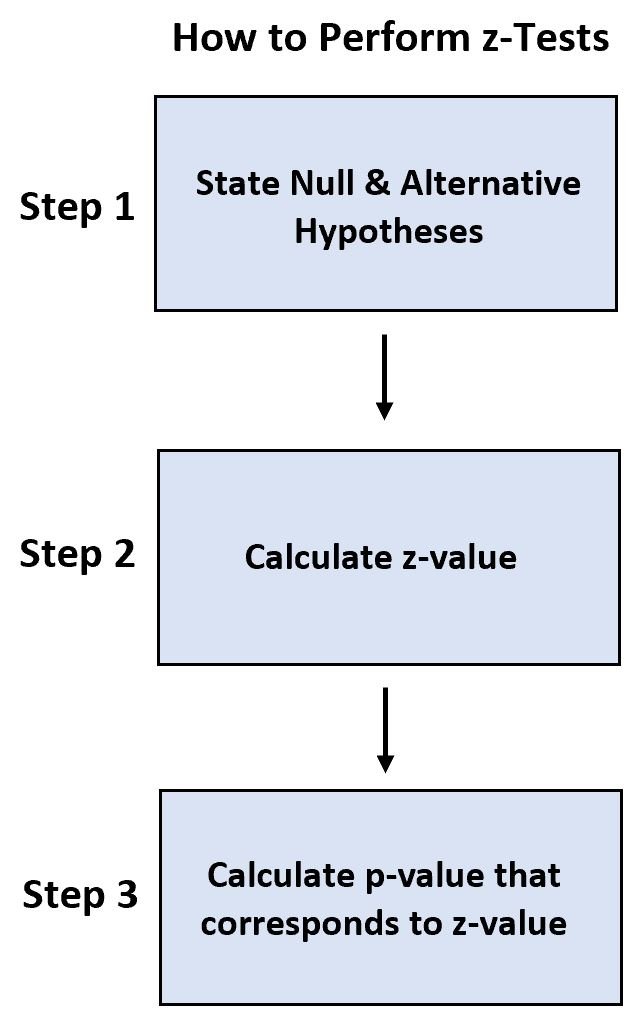
We use the following steps to perform each test:
- Step 1: State the null and alternative hypothesis.
- Step 2: Calculate the z-value.
- Step 3: Calculate the p-value that corresponds to the z-value.
For each test, the z-value is a way to quantify the difference between the population means and the p-value is the probability of obtaining a z-value with an absolute value at least as large as the one we actually observed in the sample data if the null hypothesis is actually true.
If the p-value is less than a certain value (e.g. 0.05) then we reject the null hypothesis of the test.
For each type of z-test, we’re interested in the p-value and we simply use the z-value as an intermediate step to calculating the p-value.
The following example shows how to calculate and interpret a z-value and corresponding p-value for a two-sample z-test.
Example: Calculate & Interpret Z-Values and P-Values
Suppose the IQ levels among individuals in two different cities are known to be normally distributed each with population standard deviations of 15.
A scientist wants to know if the mean IQ level between individuals in city A and city B are different, so she selects a simple random sample of 20 individuals from each city and records their IQ levels:
City A: 82, 84, 85, 89, 91, 91, 92, 94, 99, 99, 105, 109, 109, 109, 110, 112, 112, 113, 114, 114
City B: 90, 91, 91, 91, 95, 95, 99, 99, 108, 109, 109, 114, 115, 116, 117, 117, 128, 129, 130, 133
Here’s how to perform a two-sample z-test using this data:
Step 1: State the null and alternative hypothesis.
First, we’ll state the null and alternative hypotheses:
- H0: μ1 = μ2 (the two population means are equal)
- H1: μ1 ≠ μ2 (the two population means are not equal)
Step 2: Calculate the z-value.
Next, we’ll perform a two-sample z-test in Excel using this data and find that the z-value is -1.71817.
Step 3: Calculate the p-value.
We can use the Z Score to P Value Calculator to find that the p-value that corresponds to a z-value of -1.71817 is .08577.
Since this p-value is not less than .05, we do not have sufficient evidence to reject the null hypothesis.
Thus, we conclude that the mean IQ level is not significantly different between the two cities.
Notice that we simply used the z-value as an intermediate step to calculating the p-value.
The p-value is the true value that we were interested in, but we had to first calculate the z-value.
Additional Resources
The following tutorials explain how to perform z-tests using various statistical software:
How to Perform Z-Tests in Excel
How to Perform Z-Tests in R
How to Perform Z-Tests in Python


