In statistics, a z-score tells us how many standard deviations away a value is from the mean.
We use the following formula to calculate a z-score:
z = (X – μ) / σ
where:
- X is a single raw data value
- μ is the mean of the dataset
- σ is the standard deviation of the dataset
The following example shows how to calculate z-scores for raw data values in SAS.
Example: Calculate Z-Scores in SAS
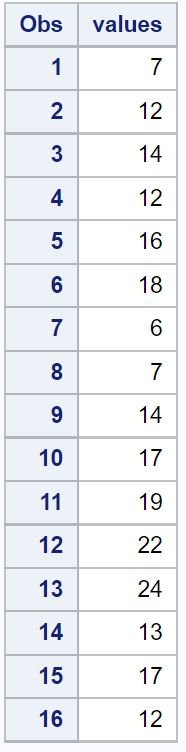
Suppose we create the following dataset in SAS:
/*create dataset*/
data original_data;
    input values;
    datalines;
7
12
14
12
16
18
6
7
14
17
19
22
24
13
17
12
;
run;

/*view dataset*/
proc print data=original_data;
Now suppose we would like to calculate the z-score for each value in the dataset.
We can use proc sql to do so:
/*create new variable that shows z-scores for each raw data value*/
proc sql;
    select values, (values - mean(values)) / std(values) as z_scores
    from original_data;
quit;
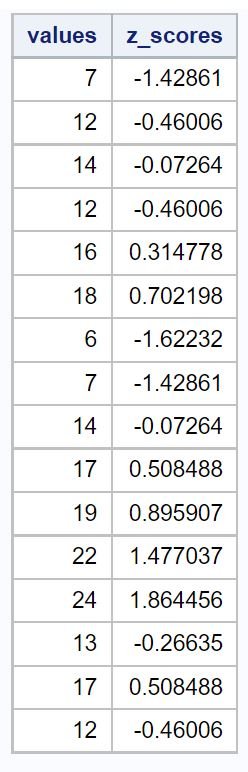
The values column shows the original data values and the z_scores column shows the z-score for each value.
How to Interpret Z-Scores in SAS
A z-score tells us how many standard deviations away a value is from the mean.
A z-score can be positive, negative, or equal to zero.
A positive z-score indicates that a particular value is greater than the mean, a negative z-score indicates that a particular value is less than the mean, and a z-score of zero indicates that a particular value is equal to the mean.
If we calculated the mean and standard deviation of our dataset, we would find that the mean is 14.375 and the standard deviation is 5.162.
So, the first value in our dataset was 7, which had a z-score of (7-14.375) / 5.162 = -1.428. This means that the value “7” is 1.428 standard deviations below the mean.
The next value in our data, 12, had a z-score of (12-14.375) / 5.162 = -0.46. This means that the value “12” is 0.46 standard deviations below the mean.
The further away a value is from the mean, the higher the absolute value of the z-score will be for that value.
For example, the value 7 is further away from the mean (14.375) compared to 12, which explains why 7 had a z-score with a larger absolute value.
Additional Resources
The following articles explain how to perform other common tasks in SAS:
How to Identify Outliers in SAS
How to Calculate Percentiles in SAS
How to Calculate Mean, Median, & Mode in SAS