Z-score normalization refers to the process of normalizing every value in a dataset such that the mean of all of the values is 0 and the standard deviation is 1.
We use the following formula to perform a z-score normalization on every value in a dataset:
New value = (x – μ) / σ
where:
- x: Original value
- μ: Mean of data
- σ: Standard deviation of data
The following example shows how to perform z-score normalization on a dataset in practice.
Example: Performing Z-Score Normalization
Suppose we have the following dataset:
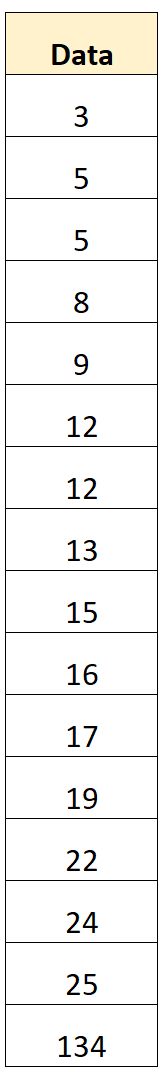
Using a calculator, we can find that the mean of the dataset is 21.2 and the standard deviation is 29.8.
To perform a z-score normalization on the first value in the dataset, we can use the following formula:
- New value = (x – μ) / σ
- New value = (3 – 21.2) / 29.8
- New value = -0.61
We can use this formula to perform a z-score normalization on every value in the dataset:
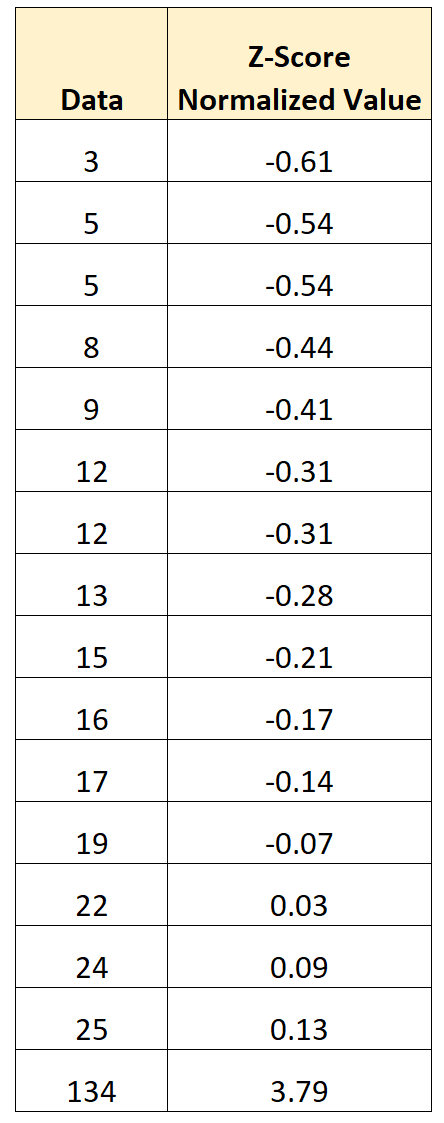
The mean of the normalized values is 0 and the standard deviation of the normalized values is 1.
The normalized values represent the number of standard deviations that the original value is from the mean.
For example:
- The first value in the dataset is 0.61 standard deviations below the mean.
- The second value in the dataset is 0.54 standard deviations below the mean.
- …
- The last value in the dataset is 3.79 standard deviations above the mean.
The benefit of performing this type of normalization is that the clear outlier in the dataset (134) has been transformed in such a way that it’s no longer a massive outlier.
If we then use this dataset to fit some type of machine learning model, the outlier will no longer have as big of an influence that it might have on the model fit.
Additional Resources
The following tutorials provide additional information on different normalization techniques:
Standardization vs. Normalization: What’s the Difference?
How to Normalize Data Between 0 and 1
How to Normalize Data Between 0 and 100