The Wilcoxon Signed-Rank Test is the non-parametric version of the paired t-test. It is used to test whether or not there is a significant difference between two population means when the distribution of the differences between the two samples cannot be assumed to be normal.
This tutorial explains how to conduct a Wilcoxon Signed-Rank Test in R.
Example: Wilcoxon Signed-Rank Test in R
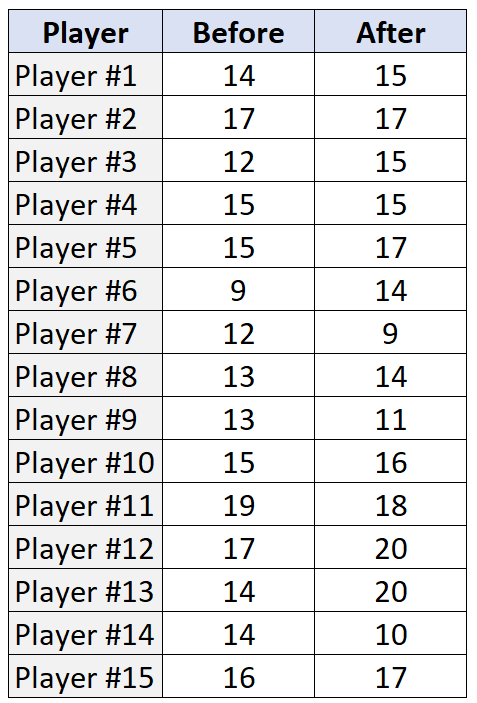
Suppose a basketball coach want to know if a certain training program increases the number of free throws made by his players. To test this, he has 15 players shoot 20 free throws each before and after the training program.
Since each player can be “paired” with themselves, the coach had planned on using a paired t-test to determine if there was a significant difference between the mean number of free throws made before and after the training program. However, the distribution of the differences turns out to be non-normal, so the coach instead uses a Wilcoxon Signed-Rank Test.
The following table shows the number of free throws made (out of 20 attempts) by each of the 15 players, both before and after the training program:
To perform the Wilcoxon Signed-Rank Test on this data in R, we can use the wilcox.test() function, which uses the following syntax:
wilcox.test(x, y, paired=TRUE)
where:
- x, y: two vectors of data values
- paired: setting this to TRUE tells R that our two vectors contained paired data
The following code illustrates how to use this function to perform the Wilcoxon Signed-Rank Test on this data:
#create the two vectors of data
before #perform Wilcoxon Signed-Rank Test
wilcox.test(before, after, paired=TRUE)

	Wilcoxon signed rank test with continuity correction

data:  before and after
V = 29.5, p-value = 0.275
alternative hypothesis: true location shift is not equal to 0
The test statistic is 29.5 and the corresponding p-value is 0.275. Since this p-value is not less than 0.05, we fail to reject the null hypothesis. There is not a statistically significant difference in the number of free throws before and after players participate in the training program.
By default, this function performs a two-sided Wilcoxon Signed-Rank Test but you can specify a left-tailed test or right-tailed test by using the alternative argument:
#perform left-tailed Wilcoxon Signed-Rank Test
wilcox.test(before, after, paired=TRUE, alternative="less")

	Wilcoxon signed rank test with continuity correction

data:  before and after
V = 29.5, p-value = 0.1375
alternative hypothesis: true location shift is less than 0

#perform right-tailed Wilcoxon Signed-Rank Test
wilcox.test(before, after, paired=TRUE, alternative="greater")

	Wilcoxon signed rank test with continuity correction

data:  before and after
V = 29.5, p-value = 0.8774
alternative hypothesis: true location shift is greater than 0
Additional Resources
An Introduction to the Wilcoxon Signed-Rank Test
Wilcoxon Signed-Rank Test Calculator


