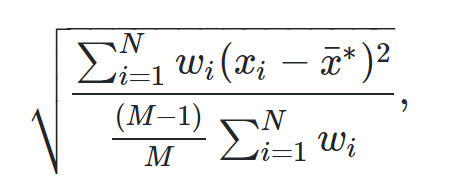
The weighted standard deviation is a useful way to measure the dispersion of values in a dataset when some values in the dataset have higher weights than others.
The formula to calculate a weighted standard deviation is:
where:
- N: The total number of observations
- M: The number of non-zero weights
- wi: A vector of weights
- xi: A vector of data values
- x: The weighted mean
The easiest way to calculate a weighted standard deviation in R is to use the wt.var() function from the Hmisc package, which uses the following syntax:
#define data values
x #define weights
wt #calculate weighted variance
weighted_var var(x, wt)

#calculate weighted standard deviation
weighted_sd
The following examples show how to use this function in practice.
Example 1: Weighted Standard Deviation for One Vector
The following code shows how to calculate the weighted standard deviation for a single vector in R:
library(Hmisc)

#define data values
x #define weights
wt #calculate weighted variance
weighted_var var(x, wt)

#calculate weighted standard deviation
sqrt(weighted_var)

[1] 8.570051
The weighted standard deviation turns out to be 8.57.
Example 2: Weighted Standard Deviation for One Column of Data Frame
The following code shows how to calculate the weighted standard deviation for one column of a data frame in R:
library(Hmisc)

#define data frame
df frame(team=c('A', 'A', 'A', 'A', 'A', 'B', 'B', 'C'),
                 wins=c(2, 9, 11, 12, 15, 17, 18, 19),
                 points=c(1, 2, 2, 2, 3, 3, 3, 3))

#define weights
wt #calculate weighted standard deviation of points
sqrt(wtd.var(df$points, wt))

[1] 0.6727938
The weighted standard deviation for the points column turns out to be 0.673.
Example 3: Weighted Standard Deviation for Multiple Columns of Data Frame
The following code shows how to use the sapply() function in R to calculate the weighted standard deviation for multiple columns of a data frame:
library(Hmisc)

#define data frame
df frame(team=c('A', 'A', 'A', 'A', 'A', 'B', 'B', 'C'),
                 wins=c(2, 9, 11, 12, 15, 17, 18, 19),
                 points=c(1, 2, 2, 2, 3, 3, 3, 3))

#define weights
wt #calculate weighted standard deviation of points and wins
sapply(df[c('wins', 'points')], function(x) sqrt(wtd.var(x, wt)))

     wins    points
4.9535723 0.6727938
The weighted standard deviation for the wins column is 4.954 and the weighted standard deviation for the points column is 0.673.
Additional Resources
How to Calculate Weighted Standard Deviation in Excel
How to Calculate Standard Deviation in R
How to Calculate the Coefficient of Variation in R
How to Calculate the Range in R


