There are three different functions you can use to calculate variance in Excel:
1. VAR.P: This function calculates the population variance. Use this function when the range of values represents the entire population.
This function uses the following formula:
Population variance = Σ(xi – μ)2 / N
where:
- Σ: A greek symbol that means “sum”
- xi: The ith value in the dataset
- μ: The population mean
- N: The total number of observations
2. VAR.S: This function calculates the sample variance. Use this function when the range of values represents a sample of values, rather than an entire population.
This function uses the following formula:
Sample variance = Σ(xi – x)2 / (n-1)
where:
- Σ: A greek symbol that means “sum”
- xi: The ith value in the dataset
- x: The sample mean
- N: The total number of observations
3. VAR: This function calculates the sample variance as well. It will return the exact same value as the VAR.S function.
Technical Note:
Since the formula for the population variance divides by N instead of n-1, the population variance will always be smaller than the sample variance.
The reason the population variance will be smaller is because if we know every value in the population, then we know the exact variance.
However, when we only have a sample of the population then we have more uncertainty around the exact variance of the overall population, so our estimate for the variance needs to be larger.
The following example shows how to use these functions in practice.
Example: VAR.P vs. VAR.S in Excel
Suppose we have the following dataset in Excel:

The following screenshot shows how to calculate the variance for the dataset using the three different variance formulas:
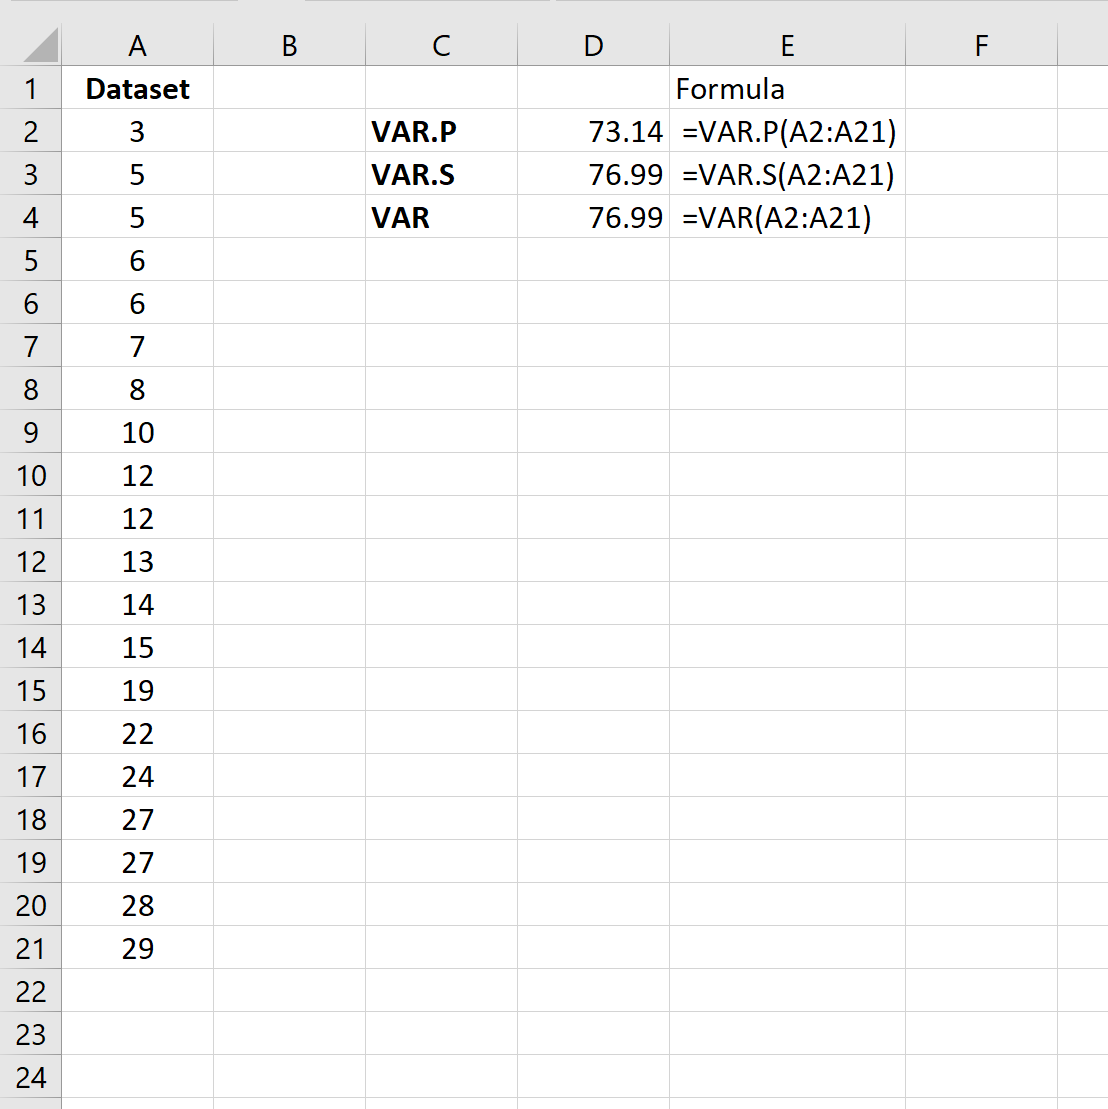
The sample variance turns out to be 76.99 and the population variance turns out to be 73.14.
As mentioned earlier, the population variance will always be smaller than the sample variance.
When to Use VAR.P vs. VAR.S
In most cases, we’re unable to collect data for an entire population so we instead collect data for just a sample of the population.
Thus, we almost always use VAR.S to calculate the variance of a dataset because our dataset typically represents a sample.
Note that VAR and VAR.S return the exact same values, so we can use either function to calculate the sample variance of a given dataset.
Additional Resources
STDEV.P vs. STDEV.S in Excel: What’s the Difference?
How to Calculate the Interquartile Range (IQR) in Excel
How to Calculate the Midrange in Excel