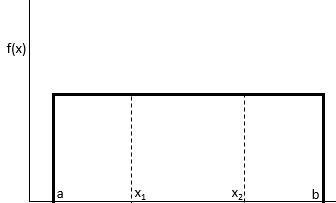
A uniform distribution is a probability distribution in which every value between an interval from a to b is equally likely to be chosen.
The probability that we will obtain a value between x1 and x2 on an interval from a to b can be found using the formula:
P(obtain value between x1 and x2) = (x2 – x1) / (b – a)
The uniform distribution has the following properties:
- The mean of the distribution is μ = (a + b) / 2
- The variance of the distribution is σ2 = (b – a)2 / 12
- The standard deviation of the distribution is σ = √σ2
The following examples show how to calculate probabilities for uniform distributions in Excel.
Note: You can double check the solution to each example below using the Uniform Distribution Calculator.
Examples: Uniform Distribution in Excel
Example 1: A bus shows up at a bus stop every 20 minutes. If you arrive at the bus stop, what is the probability that the bus will show up in 8 minutes or less?
Solution:
- a: 0 minutes
- b: 20 minutes
- x1: 0 minutes
- x2: 8 minutes
The probability that the bus shows up in 8 minutes or less is 0.4.
Example 2:The weight of a certain species of frog is uniformly distributed between 15 and 25 grams. If you randomly select a frog, what is the probability that the frog weighs between 17 and 19 grams?
Solution:
- a: 15 grams
- b: 25 grams
- x1: 17 grams
- x2: 19 grams
The probability that the frog weighs between 17 and 19 grams is 0.2.
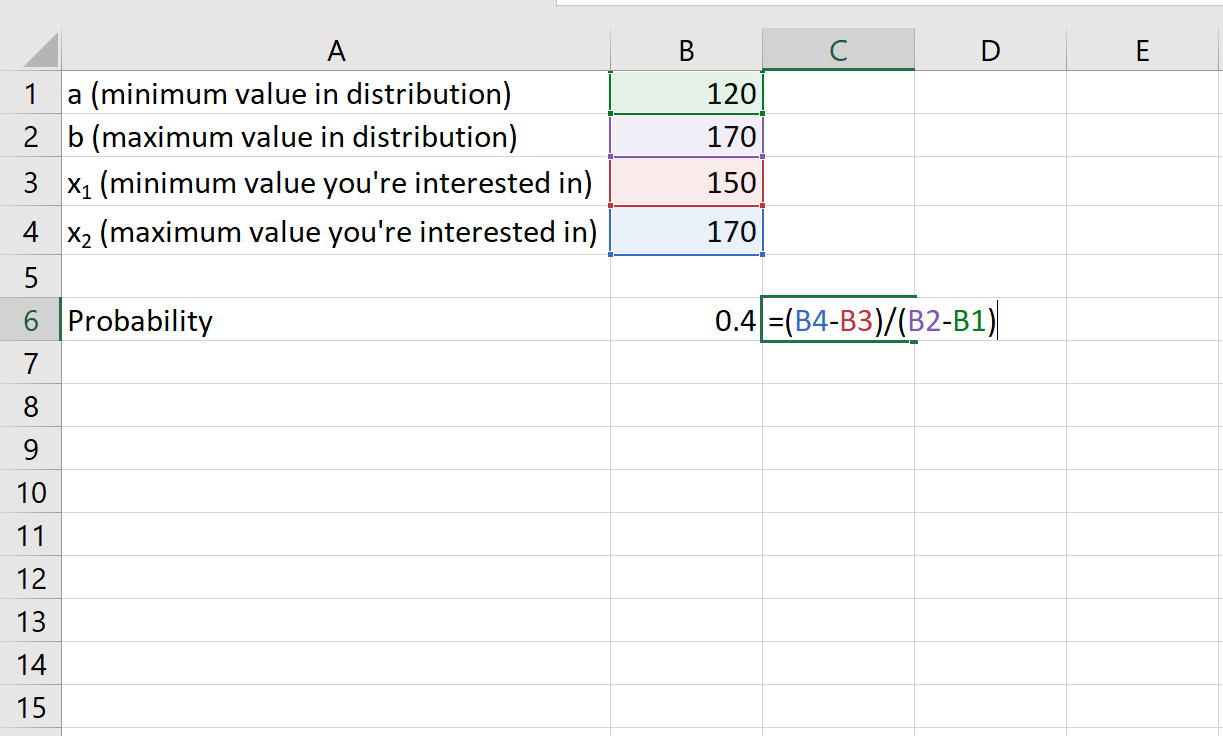
Example 3: The length of an NBA game is uniformly distributed between 120 and 170 minutes. What is the probability that a randomly selected NBA game lasts more than 150 minutes?
Solution:
- a: 120 minutes
- b: 170 minutes
- x1: 150 minutes
- x2: 170 minutes
The probability that a randomly selected NBA game lasts more than 150 minutes is 0.4.
Find more Excel tutorials on this page.


