Suppose we conduct a survey in which we ask 15 households how many pets they have in their home. The results are as follows:
1, 1, 1, 1, 2, 2, 2, 3, 3, 4, 5, 5, 6, 7, 8
One way to summarize these results is to create a frequency distribution, which tells us how frequently different values occur in a dataset.
Often we use grouped frequency distributions, in which we create groups of values and then summarize how many observations from a dataset fall into those groups.
Here’s an example of a grouped frequency distribution for our survey data:
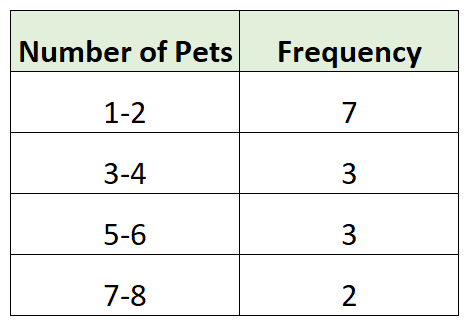
We first created groups of size 2, then we counted how many individual observations from the dataset fell in each group. For example:
- 7 families had either 1 or 2 pets
- 3 families had either 3 or 4 pets
- 3 families had either 5 or 6 pets
- 2 families had either 7 or 8 pets
Another type of frequency distribution we could create is an ungrouped frequency distribution, which displays the frequency of each individual data value rather groups of data values.
Here’s an example of an ungrouped frequency distribution for our survey data:
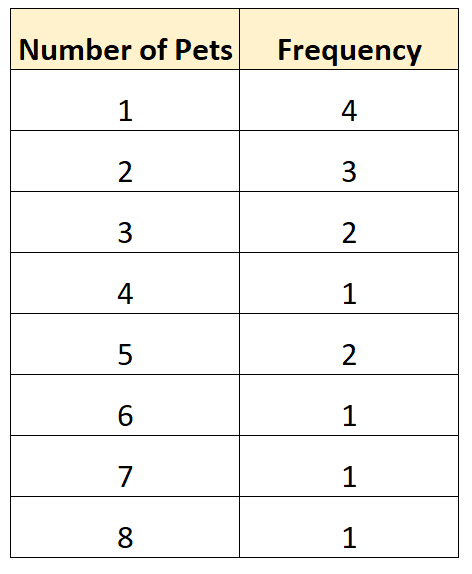
This type of frequency distribution allows us to directly see how often different values occurred in our dataset. For example:
- 4 families had 1 pet
- 3 families had 2 pets
- 2 families had 3 pets
- 1 family had 4 pets
And so on.
When to Use Ungrouped Frequency Distributions
Ungrouped frequency distributions can be useful when you want to see how often each individual value occurs in a dataset.
Note that ungrouped frequency distributions work best with small datasets in which there are only a few unique values.
For example, in our survey data from earlier there were only 8 unique values so it made sense to create an ungrouped frequency distribution.
However, if we had a dataset with hundreds or thousands of unique values, an ungrouped frequency distribution would be incredibly long and difficult to gather information from.
For larger datasets, it makes sense to construct grouped frequency distributions.
How to Visualize Ungrouped Frequency Distributions
The easiest way to visualize the values in an ungrouped frequency distribution is to create a frequency polygon, which displays the frequencies of each individual value in a simple chart.
Here’s what a frequency polygon would look like for our sample data:
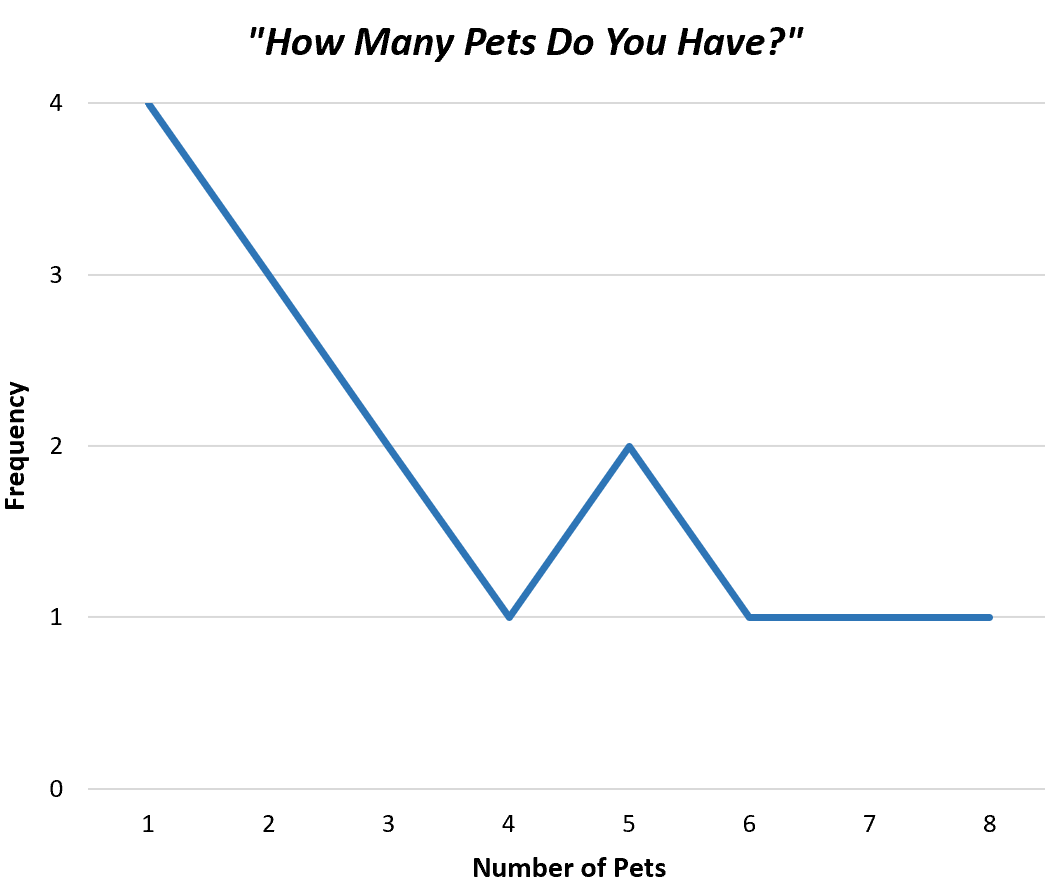
This helps us quickly gain an understanding of how often each value occurs in the dataset.
Alternatively, we could create a bar chart to display the exact same data using bars rather than a single line:
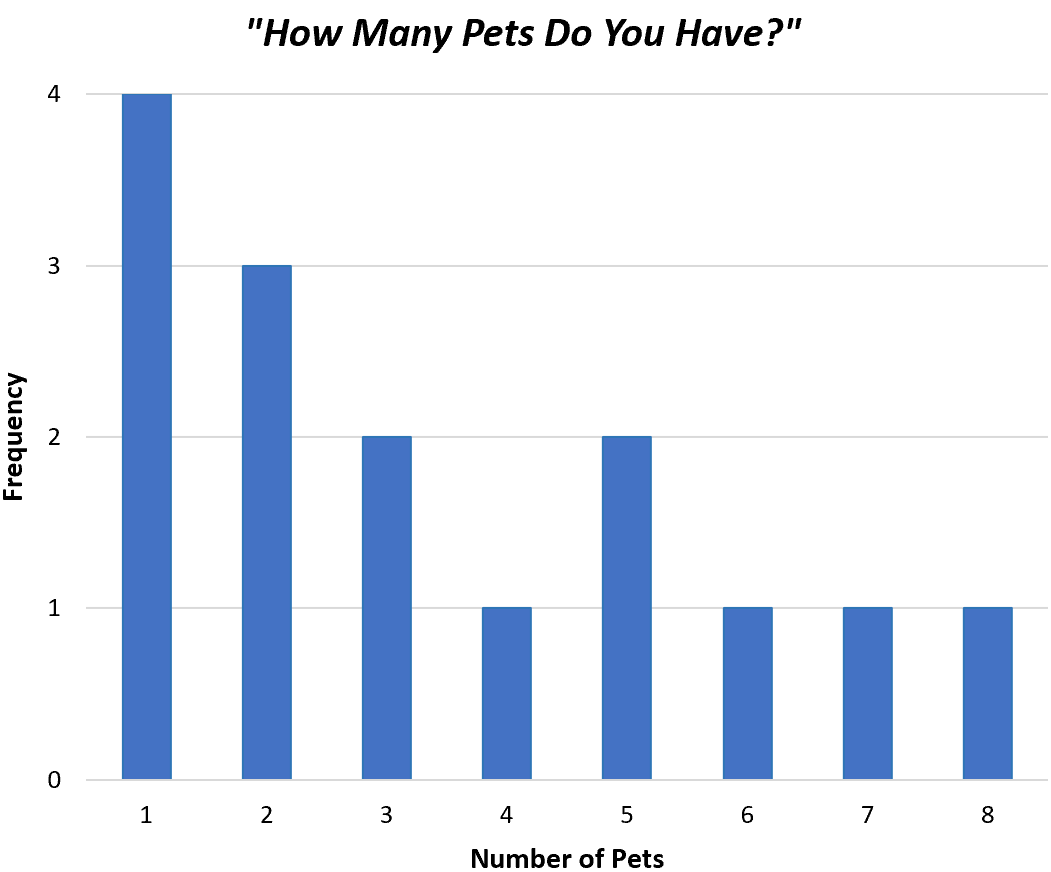
Both charts allow us to quickly understand the distribution of values in our dataset.