A two-way table is a type of table that displays the frequencies for two categorical variables.
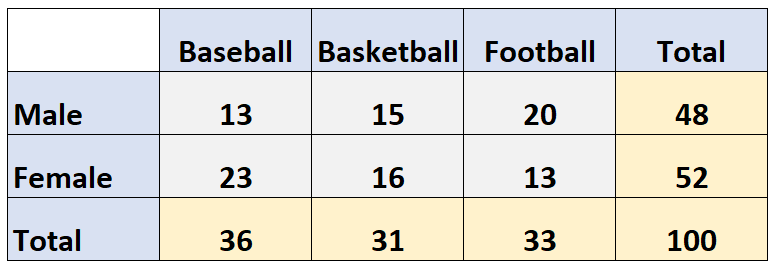
For example, the following two-way table shows the results of a survey that asked 100 people which sport they liked best: baseball, basketball, or football.
The rows display the gender of the respondent and the columns show which sport they chose:
This tutorial provides several examples of how to create and work with two-way tables in R.
Example 1: Create a Two Way Table from Scratch
The following code shows how to create a two way table from scratch using the as.table() function:
#create matrix
data 3)

#specify row and column names of matrix
rownames(data)

#convert matrix to table
data table(data)

#display table
data

       Baseball Basketball Football
Male         13         15       20
Female       23         16       13
Example 2: Create a Two Way Table from Data
The following code shows how to create a two-way table from a data frame:
#create data frame
df frame(sport=c('Base', 'Base', 'Bask', 'Foot', 'Foot'),
                 gender=c('Male', 'Female', 'Male', 'Male', 'Female'))

#view data frame
df

#create two way table from data frame
data #display two way table
data

         Base Bask Foot
  Female    1    0    1
  Male      1    1    1
Example 3: Calculate Margin Sums of a Two Way Table
The following code shows how to calculate margin sums of a two-way table using the margin.table() function:
#create matrix of data
data Male', 'Female')
colnames(data) Baseball', 'Basketball', 'Football')

#find sum of genders
margin.table(data, margin=1)

  Male Female
    49     51

#find sum of sports

margin.table(data, margin=2)

  Baseball Basketball   Football
        28         43         29
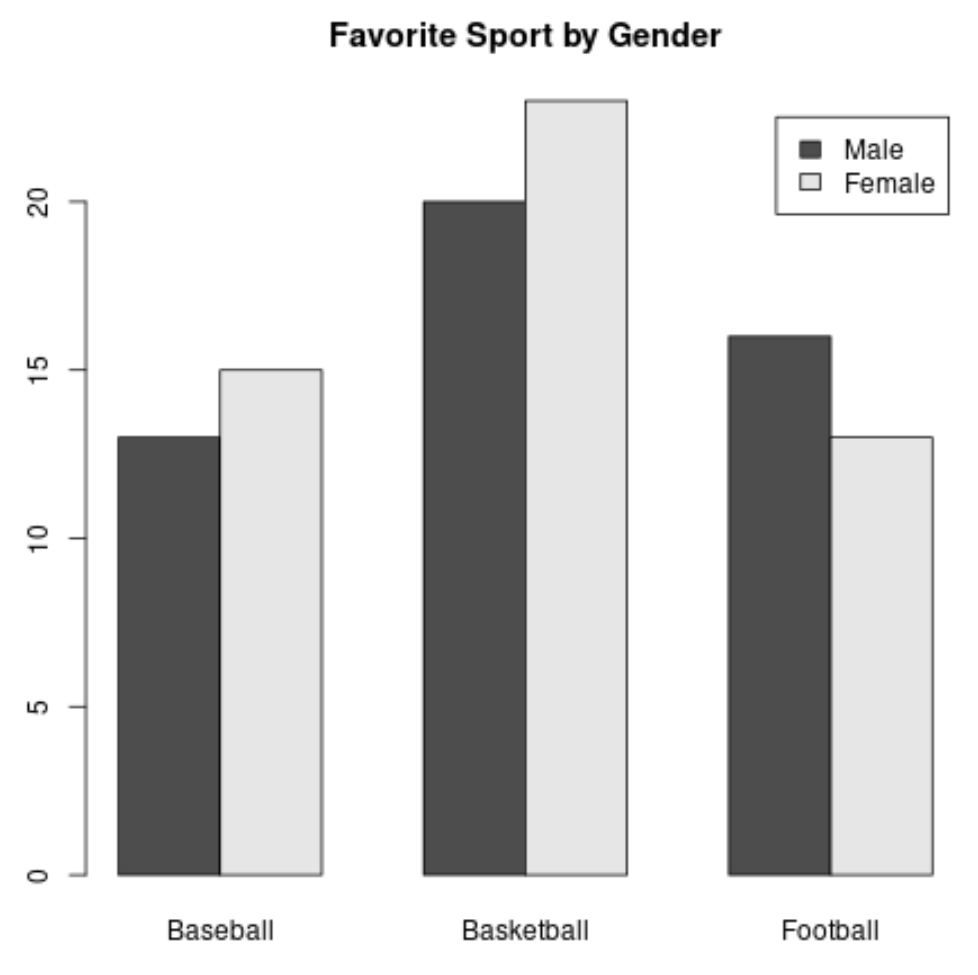
Example 4: Visualize Two Way Table Frequencies
One way to visualize the frequencies in a two way table is to create a barplot:
barplot(data, legend=True, beside=True, main='Favorite Sport by Gender')
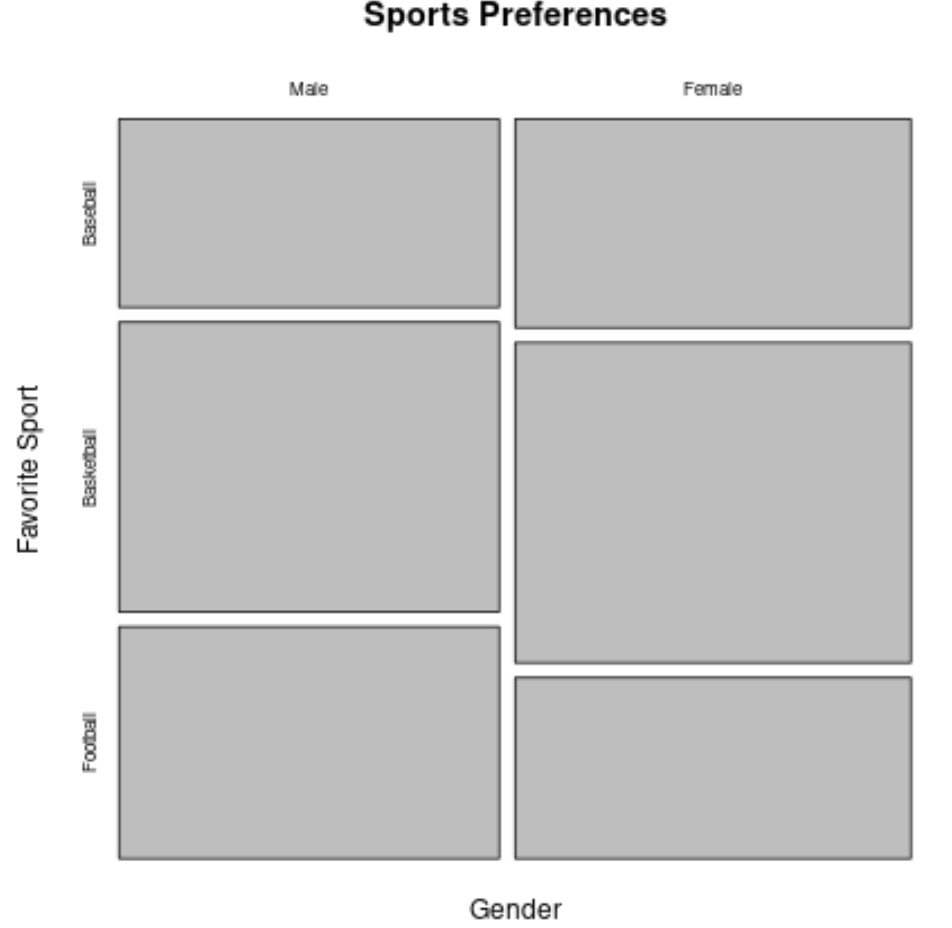
Another way to visualize the frequencies in a two way table is to create a mosaic plot:
mosaicplot(data, main='Sports Preferences', xlab='Gender', ylab='Favorite Sport')
You can find more R tutorials on this page.