A two sample t-test is used to determine whether or not two population means are equal.
This tutorial explains how to perform a two sample t-test in SAS.
Example: Two Sample t-Test in SAS
Suppose a botanist wants to know if the mean height of two different species of plants is equal. She collects a random sample of 12 plants from each species and and records their heights in inches.
The heights are as follows:
Sample 1: 13, 15, 15, 16, 16, 16, 17, 18, 18, 19, 20, 21
Sample 2: 15, 15, 16, 18, 19, 19, 19, 20, 21, 23, 23, 24
Use the following steps to conduct a two sample t-test to determine if the mean height is equal between the two species.
Step 1: Create the data.
First, we’ll use the following code to create the dataset in SAS:
/*create dataset*/
data my_data;
    input Species $ Height;
    datalines;
1 13
1 15
1 15
1 16
1 16
1 16
1 17
1 18
1 18
1 19
1 20
1 21
2 15
2 15
2 16
2 18
2 19
2 19
2 19
2 20
2 21
2 23
2 23
2 24
;
run;
Step 2: Perform a two sample t-test.
Next, we’ll use proc ttest to perform the two sample t-test:
/*perform two sample t-test*/
proc ttest data=my_data sides=2 alpha=0.05  h0=0;
    class Species;
    var Height;
run;
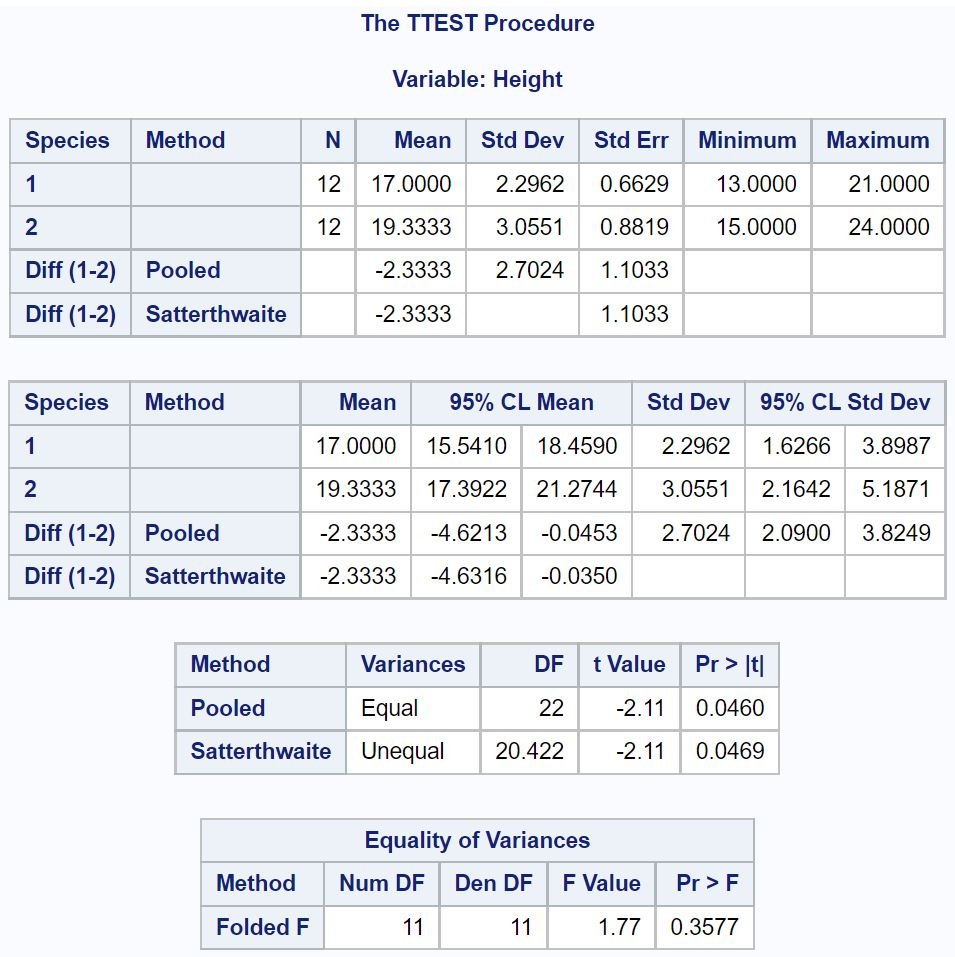
The last table titled Equality of Variances performs an F-test to determine if the variances are equal between the two samples.
Since the p-value (.3577) of this test is not less than .05, we can assume the two sample variances are equal.
Thus, we can refer to the row titled Equal in the second to last table to determine the t value and corresponding p-value to use:
- t Value: -2.11
- p-value: .0460
Recall that the two sample t-test uses the following null and alternative hypotheses:
- H0: μ1 = μ2
- HA: μ1 ≠ μ2
Since the p-value (.0460) is less than .05, we reject the null hypothesis.
This means we have sufficient evidence to say that the mean height between the two species of plants is not equal.
Additional Resources
The following tutorials explain how to perform other common statistical tests in SAS:
How to Perform a Wilcoxon Signed Rank Test in SAS
How to Perform a One-Way ANOVA in SAS