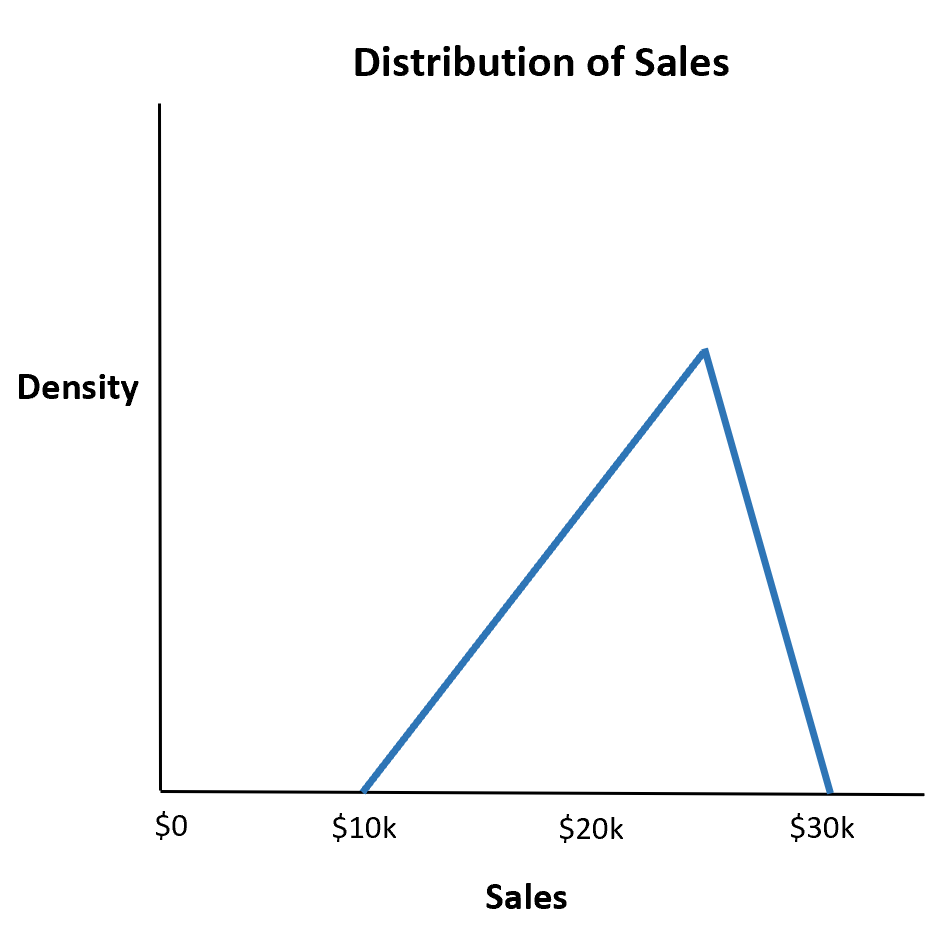
The triangular distribution is a continuous probability distribution with a probability density function shaped like a triangle.
It is defined by three values:
- The minimum value a
- The maximum value b
- The peak value c
The name of the distribution comes from the fact that the probability density function is shaped like a triangle.
It turns out that this distribution is extremely useful in the real world because we can often estimate the minimum value (a), the maximum value (b), and the most likely value (c) that a random variable will take on, so we can often model the behavior of random variables by using a triangular distribution with the knowledge of just these three values.
For example, a restaurant might estimate that their total sales for the upcoming week will be a minimum of $10,000, a maximum of $30,000, and most likely $25,000.
Using just these three numbers, they could use a triangular distribution to find the probability that they’ll achieve a certain number of sales.
Properties of the Triangular Distribution
The triangular distribution has the following properties:
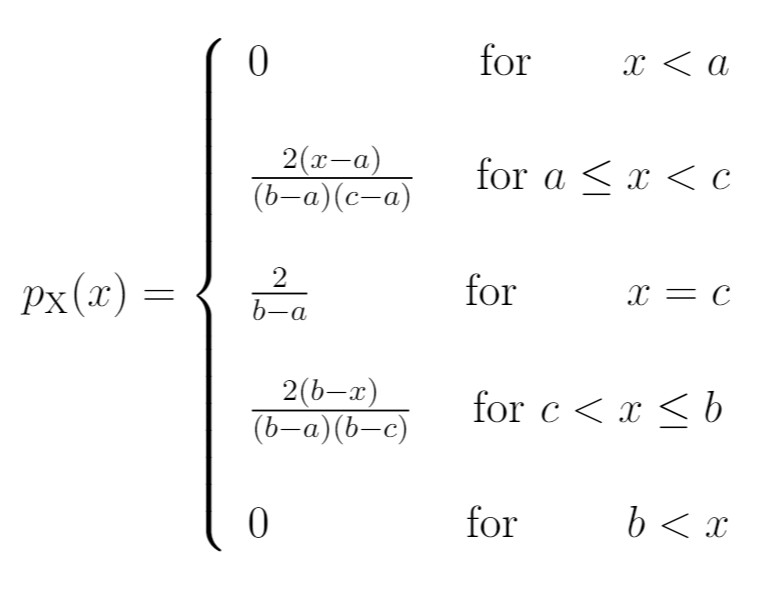
PDF:
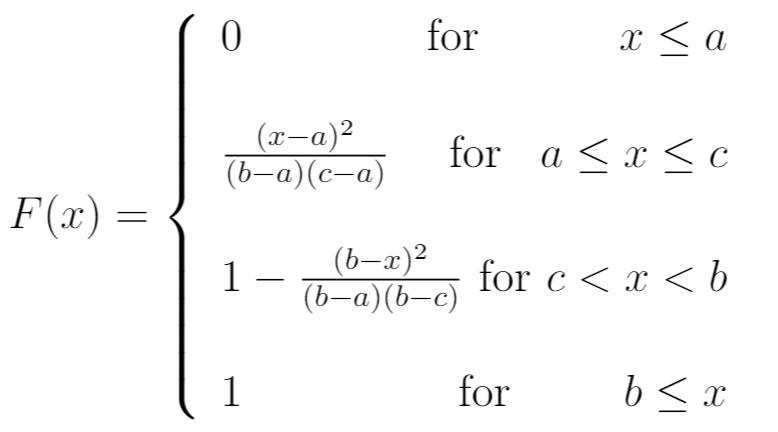
CDF:
Mean: (a + b + c) / 3
Mode: c
Variance: (a2 + b2 + c2 – ab – ac – bc) / 18
Example of Using the Triangular Distribution
Let’s return to the example from earlier. Suppose a restaurant estimates that their total sales for the upcoming week will be a minimum of $10,000, a maximum of $30,000, and most likely $25,000.
What is the probability that the restaurant makes less than $20,000 total sales?
To answer this, we can let x = total sales. We know that x is between the minimum value a of $10k and the peak value c of $25k.
Thus, according to the PDF we can use the following equation to find the probability that the restaurant makes less than $20,000 total sales:
- P(X 2 / ((b-a)(c-a))
- P(X 2 / ((30,000-10,000)(25,000-10,000))
- P(X
The probability that the restaurant makes less than $20,000 total sales is .333.
What is the mean expected sales for the restaurant?
We can calculate the mean expected sales using the formula for the mean given earlier:
- Mean = (a + b + c) / 3
- Mean = ($10,000 + $30,000 + $25,000) / 3
- Mean = $21,667
The mean expected sales is 21,667.
Additional Resources
The following tutorials provide introductions to other commonly used distributions:
The Normal Distribution
The Binomial Distribution
The Poisson Distribution
The Geometric Distribution


