Many statistical tests make the assumption that datasets are normally distributed. However, this is often not the case in practice.
One way to address this issue is to transform the distribution of values in a dataset using one of the three transformations:
1. Log Transformation: Transform the response variable from y to log(y).
2. Square Root Transformation: Transform the response variable from y to √y.
3. Cube Root Transformation: Transform the response variable from y to y1/3.
By performing these transformations, the dataset typically becomes more normally distributed.
The following examples show how to perform these transformations in Python.
Log Transformation in Python
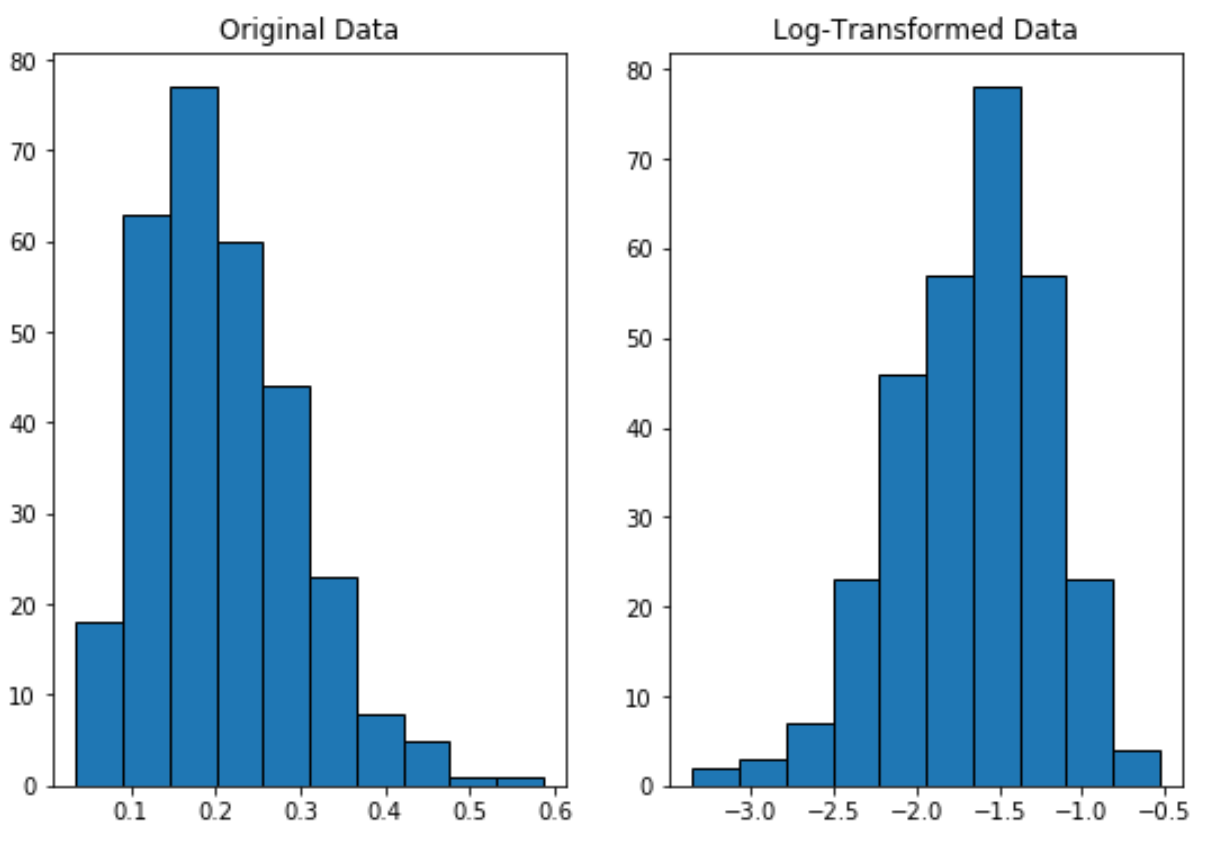
The following code shows how to perform a log transformation on a variable and create side-by-side plots to view the original distribution and the log-transformed distribution of the data:
import numpy as np
import matplotlib.pyplot as plt

#make this example reproducible
np.random.seed(0)

#create beta distributed random variable with 200 values
data = np.random.beta(a=4, b=15, size=300)

#create log-transformed data
data_log = np.log(data)

#define grid of plots
fig, axs = plt.subplots(nrows=1, ncols=2)

#create histograms
axs[0].hist(data, edgecolor='black')
axs[1].hist(data_log, edgecolor='black')

#add title to each histogram
axs[0].set_title('Original Data')
axs[1].set_title('Log-Transformed Data')
Notice how the log-transformed distribution is more normally distributed compared to the original distribution.
It’s still not a perfect “bell shape” but it’s closer to a normal distribution that the original distribution.
Square Root Transformation in Python
The following code shows how to perform a square root transformation on a variable and create side-by-side plots to view the original distribution and the square root transformed distribution of the data:
import numpy as np
import matplotlib.pyplot as plt

#make this example reproducible
np.random.seed(0)

#create beta distributed random variable with 200 values
data = np.random.beta(a=1, b=5, size=300)

#create log-transformed data
data_log = np.sqrt(data)

#define grid of plots
fig, axs = plt.subplots(nrows=1, ncols=2)

#create histograms
axs[0].hist(data, edgecolor='black')
axs[1].hist(data_log, edgecolor='black')

#add title to each histogram
axs[0].set_title('Original Data')
axs[1].set_title('Square Root Transformed Data')
Notice how the square root transformed data is much more normally distributed than the original data.
Cube Root Transformation in Python
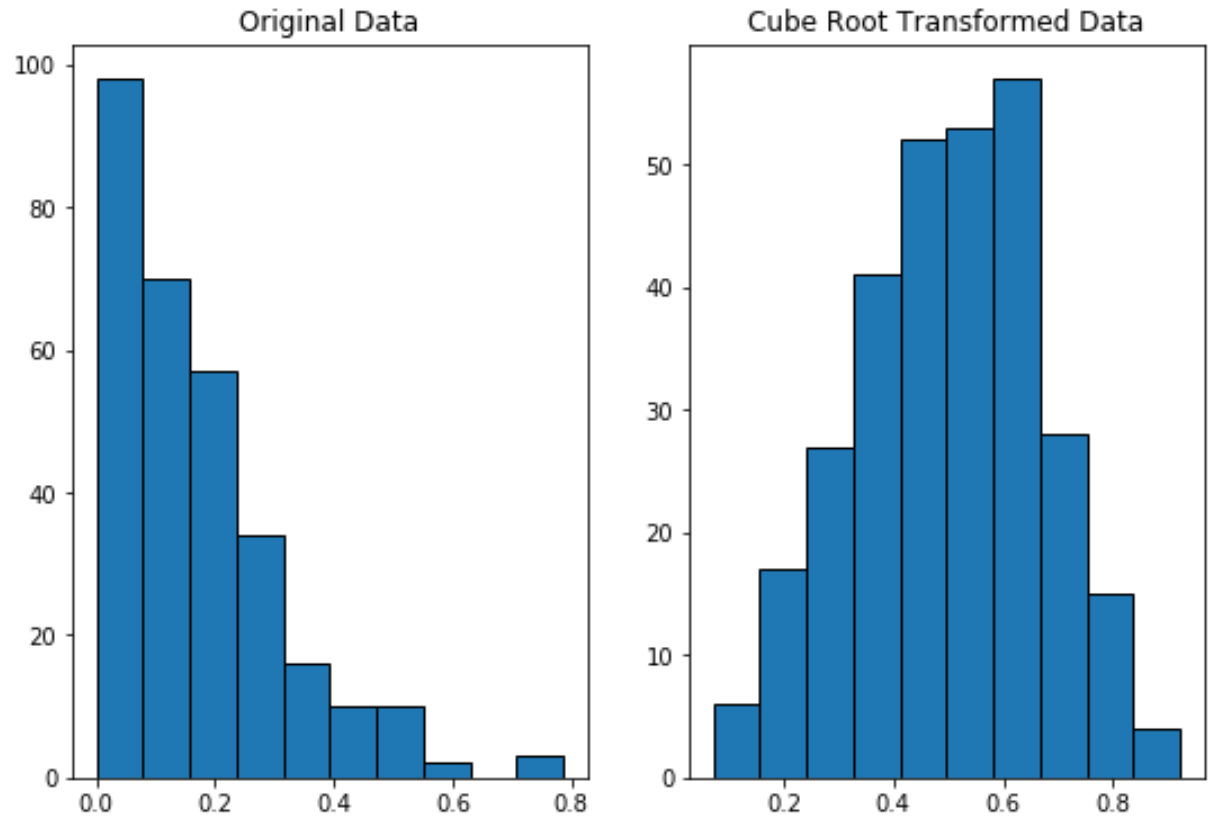
The following code shows how to perform a cube root transformation on a variable and create side-by-side plots to view the original distribution and the cube root transformed distribution of the data:
import numpy as np
import matplotlib.pyplot as plt

#make this example reproducible
np.random.seed(0)

#create beta distributed random variable with 200 values
data = np.random.beta(a=1, b=5, size=300)

#create log-transformed data
data_log = np.cbrt(data)

#define grid of plots
fig, axs = plt.subplots(nrows=1, ncols=2)

#create histograms
axs[0].hist(data, edgecolor='black')
axs[1].hist(data_log, edgecolor='black')

#add title to each histogram
axs[0].set_title('Original Data')
axs[1].set_title('Cube Root Transformed Data')
Notice how the cube root transformed data is much more normally distributed than the original data.
Additional Resources
How to Calculate Z-Scores in Python
How to Normalize Data in Python
What is the Assumption of Normality in Statistics?


