In statistics, a third variable problem occurs when an observed correlation between two variables can actually be explained by a third variable that hasn’t been accounted for.
When this third variable is not taken into account, the correlation between the two variables under study can be misleading and even confusing.
This tutorial provides several examples of third variable problems in different settings.
Example 1: Dogs & Fire Hydrants
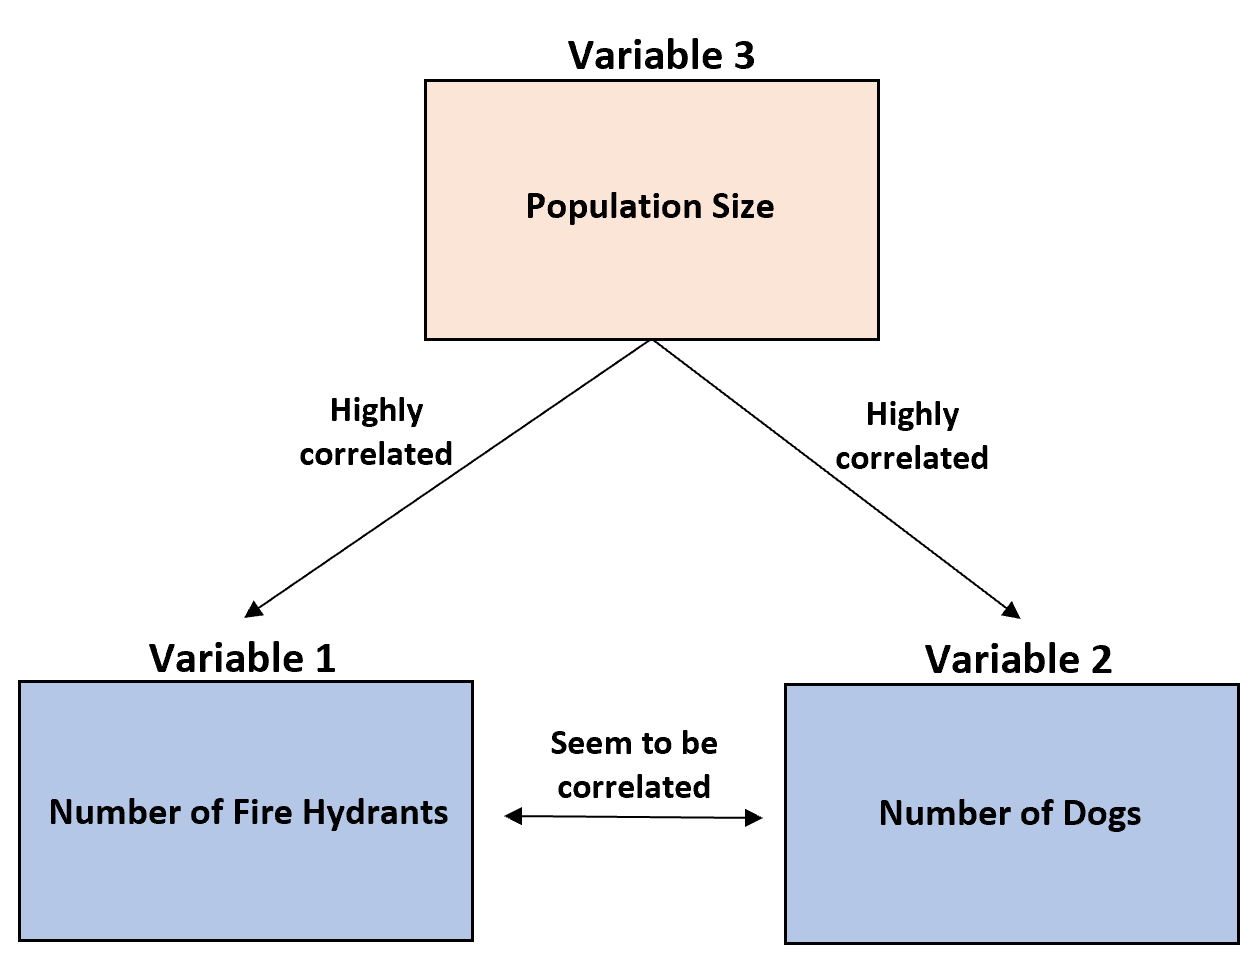
A researcher observes that cities with more fire hydrants tend to also have more dogs.
However, these two variables are only correlated because they both have a high correlation with a third variable: population size.
Larger cities tend to have both more fire hydrants and more dogs. Conversely, smaller cities tend to have fewer fire hydrants and fewer dogs.
Example 2: Ice Cream Sales & Shark Attacks
A researcher finds that ice cream sales and shark attacks are highly positively correlated.
However, these two variables are only correlated because they both have a high correlation with a third variable: temperature.
When it’s warmer out, more people buy ice cream and more people swim in the ocean which explains why the values for both ice cream sales and shark attacks tend to increase during the same times of the year.
Example 3: Volunteers & Natural Disasters
A study finds that the more volunteers that show up after a natural disaster, the greater the damage.
However, these two variables are only correlated because they both have a high correlation with a third variable: size of the natural disaster.
Larger natural disasters are highly correlated with more damage done as well as an increase in the number of volunteers.
Related Articles
What is Omitted Variable Bias?
What is Undercoverage Bias?
What is Aggregation Bias?
What is a Confounding Variable?


