You can use the following syntax to adjust the size of subplots in Matplotlib:
#specify one size for all subplots
fig, ax = plt.subplots(2, 2, figsize=(10,7))

#specify individual sizes for subplots
fig, ax = plt.subplots(1, 2, gridspec_kw={'width_ratios': [3, 1]})
The following examples show how to use this syntax in practice.
Example 1: Specify One Size for All Subplots
The following code shows how to specify one size for all subplots:
import matplotlib.pyplot as plt

#define subplots
fig, ax = plt.subplots(2, 2, figsize=(10,7))
fig.tight_layout()

#define data
x = [1, 2, 3]
y = [7, 13, 24]

#create subplots
ax[0, 0].plot(x, y, color='red')
ax[0, 1].plot(x, y, color='blue')
ax[1, 0].plot(x, y, color='green')
ax[1, 1].plot(x, y, color='purple')
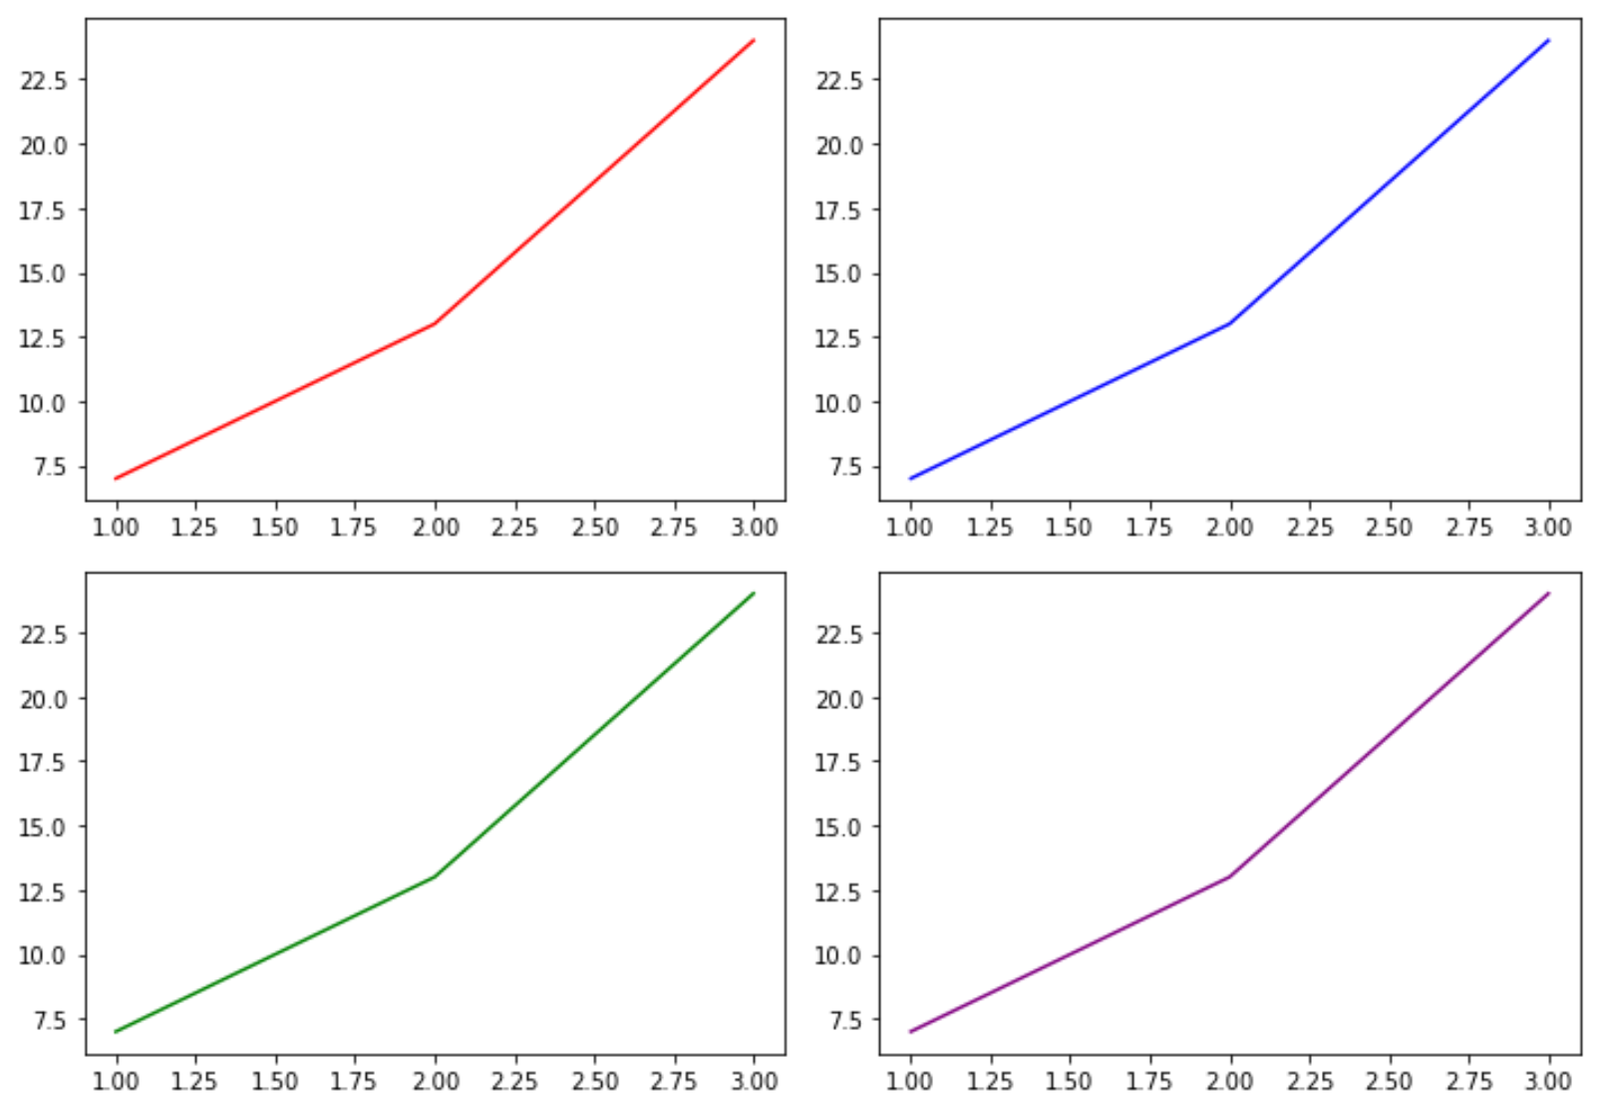
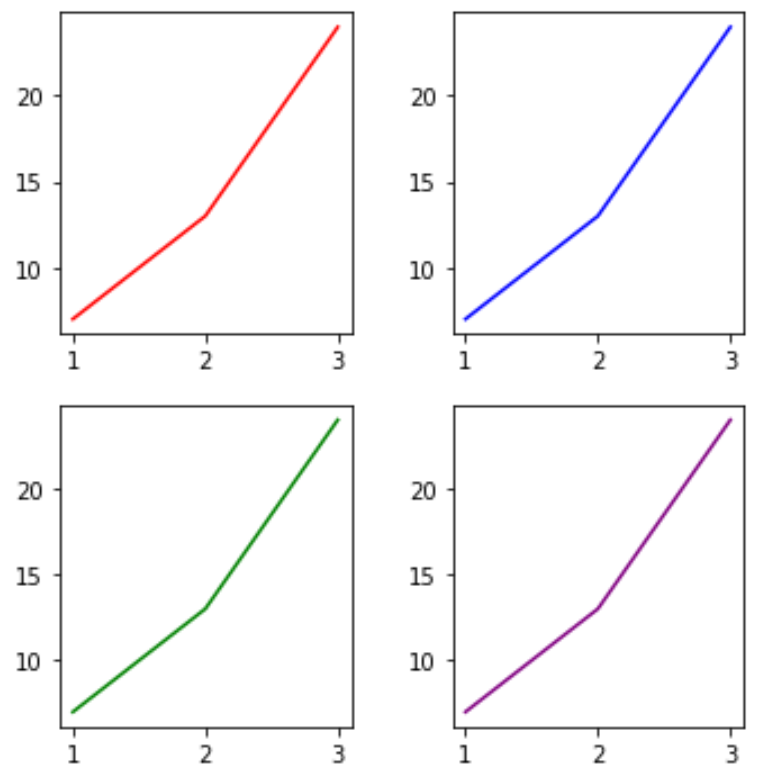
We can easily change the size of the subplots by changing the values in the figsize argument:
import matplotlib.pyplot as plt

#define subplots
fig, ax = plt.subplots(2, 2, figsize=(5,5))
fig.tight_layout()

#define data
x = [1, 2, 3]
y = [7, 13, 24]

#create subplots
ax[0, 0].plot(x, y, color='red')
ax[0, 1].plot(x, y, color='blue')
ax[1, 0].plot(x, y, color='green')
ax[1, 1].plot(x, y, color='purple')
Example 2: Specify Sizes for Individual Subplots
The following code shows how to specify different sizes for individual subplots:
import matplotlib.pyplot as plt

#define subplots
fig, ax = plt.subplots(1, 2, gridspec_kw={'width_ratios': [3, 1]})
fig.tight_layout()

#define data
x = [1, 2, 3]
y = [7, 13, 24]

#create subplots
ax[0].plot(x, y, color='red')
ax[1].plot(x, y, color='blue')

We can easily change the size of the subplots by changing the values in the width_ratios argument:
import matplotlib.pyplot as plt

#define subplots
fig, ax = plt.subplots(1, 2, gridspec_kw={'width_ratios': [1, 3]})
fig.tight_layout()

#define data
x = [1, 2, 3]
y = [7, 13, 24]

#create subplots
ax[0].plot(x, y, color='red')
ax[1].plot(x, y, color='blue')

Additional Resources
How to Add Titles to Plots in Matplotlib
How to Set Axis Ranges in Matplotlib
How to Set X-Axis Values in Matplotlib