Whenever we fit a linear regression model, the model takes on the following form:
Y = β0 + β1X + … + βiX +ϵ
where ϵ is an error term that is independent of X.
No matter how well X can be used to predict the values of Y, there will always be some random error in the model.
One way to measure the dispersion of this random error is by using the standard error of the regression model, which is a way to measure the standard deviation of the residuals ϵ.
This tutorial provides a step-by-step example of how to calculate the standard error of a regression model in Excel.
Step 1: Create the Data
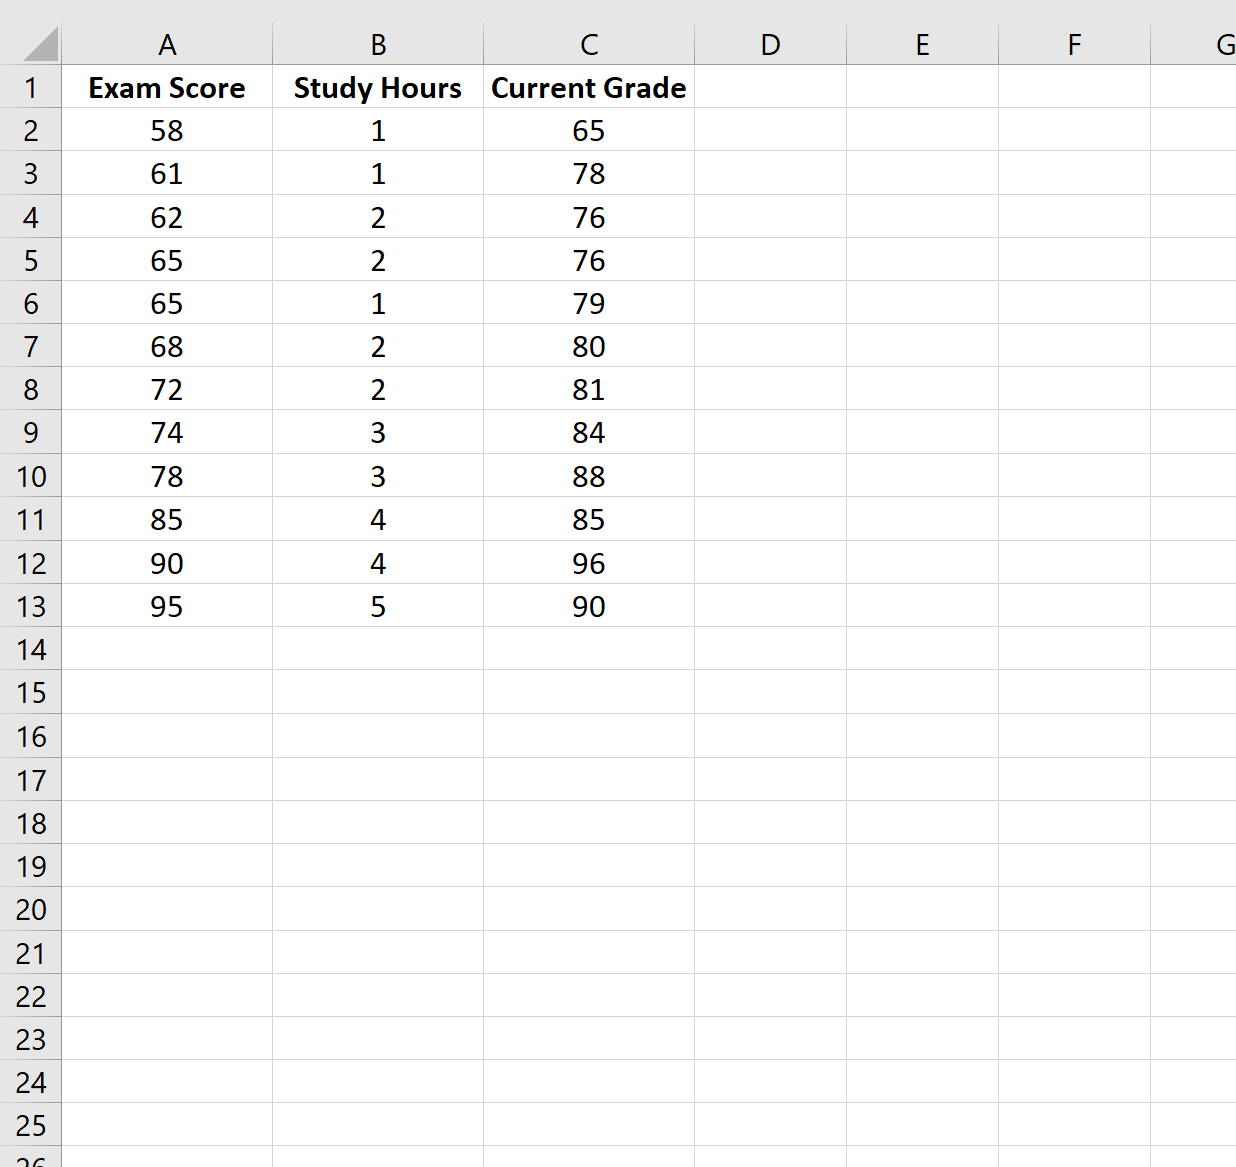
For this example, we’ll create a dataset that contains the following variables for 12 different students:
- Exam Score
- Hours Spent Studying
- Current Grade
Step 2: Fit the Regression Model
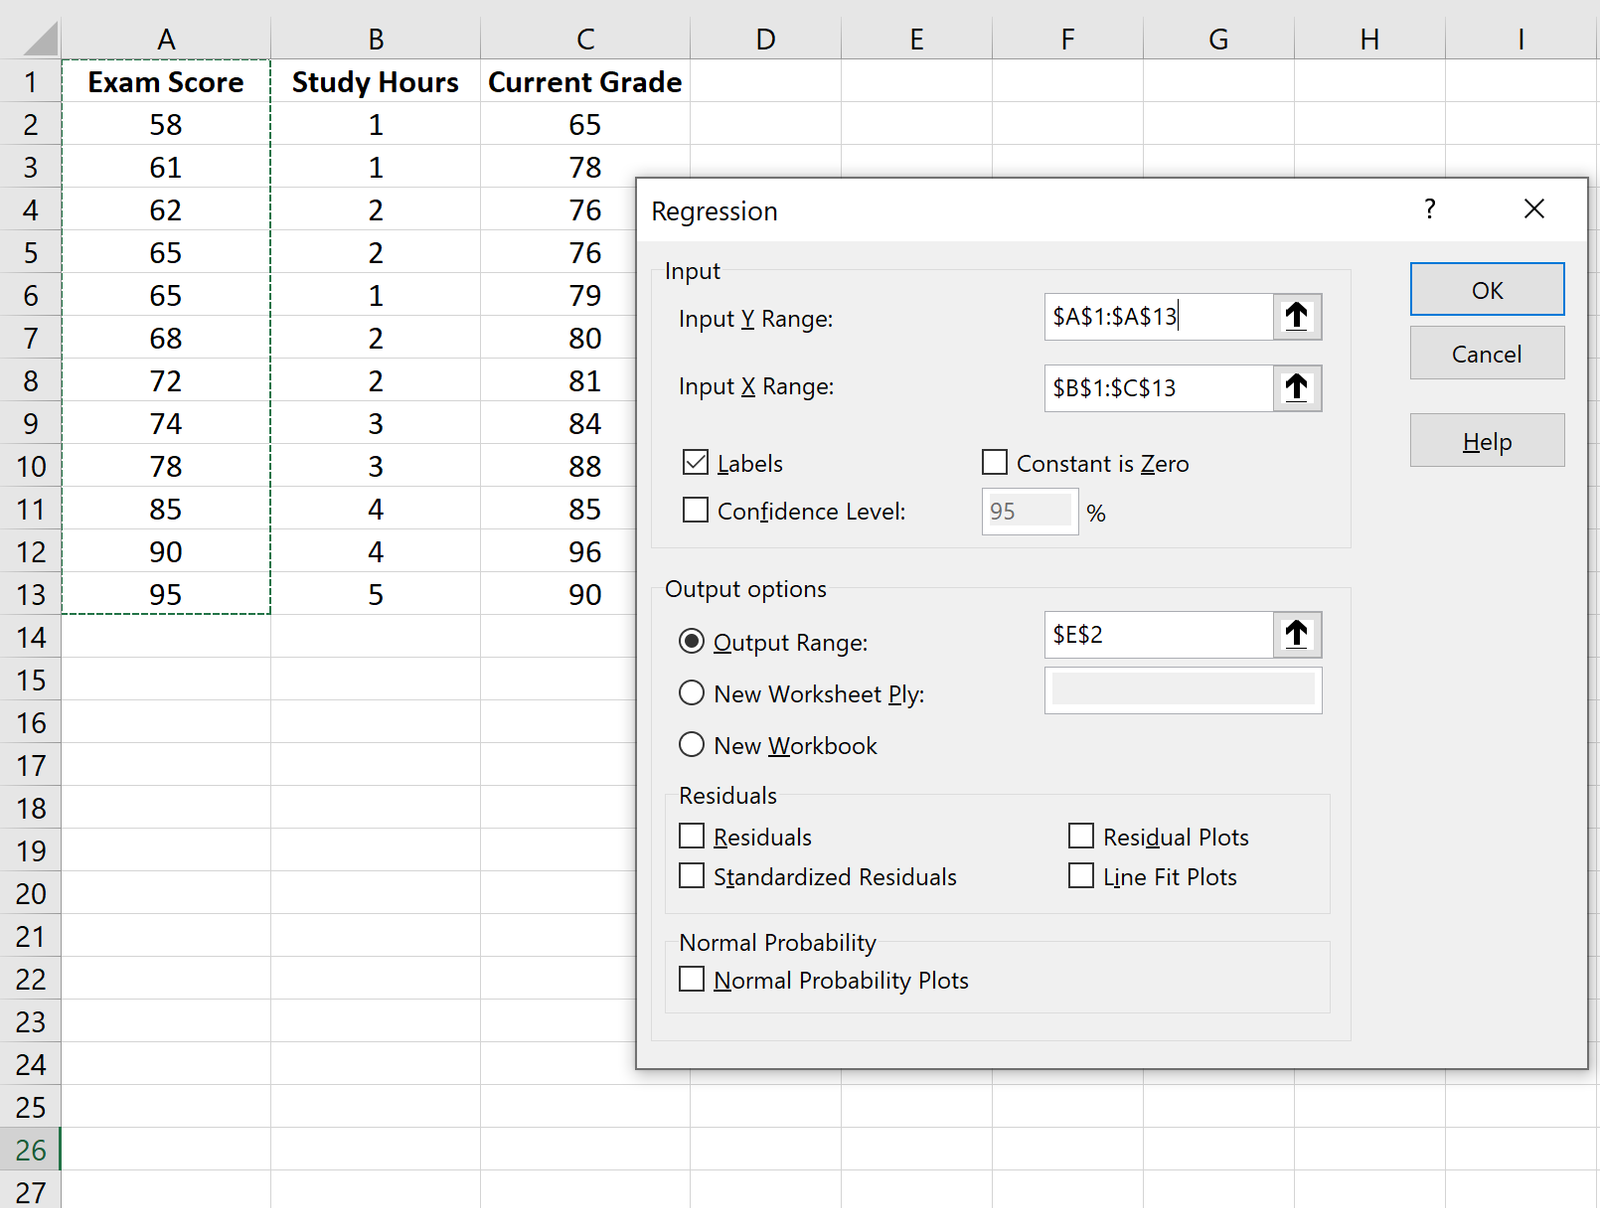
Next, we’ll fit a multiple linear regression model using Exam Score as the response variable and Study Hours and Current Grade as the predictor variables.
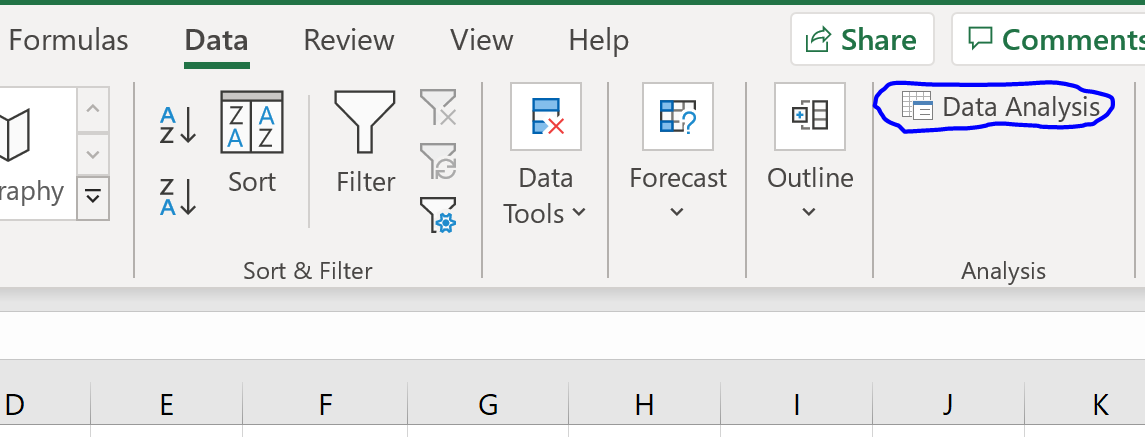
To do so, click the Data tab along the top ribbon and then click Data Analysis:
If you don’t see this option available, you need to first load the Data Analysis ToolPak.
In the window that pops up, select Regression. In the new window that appears, fill in the following information:
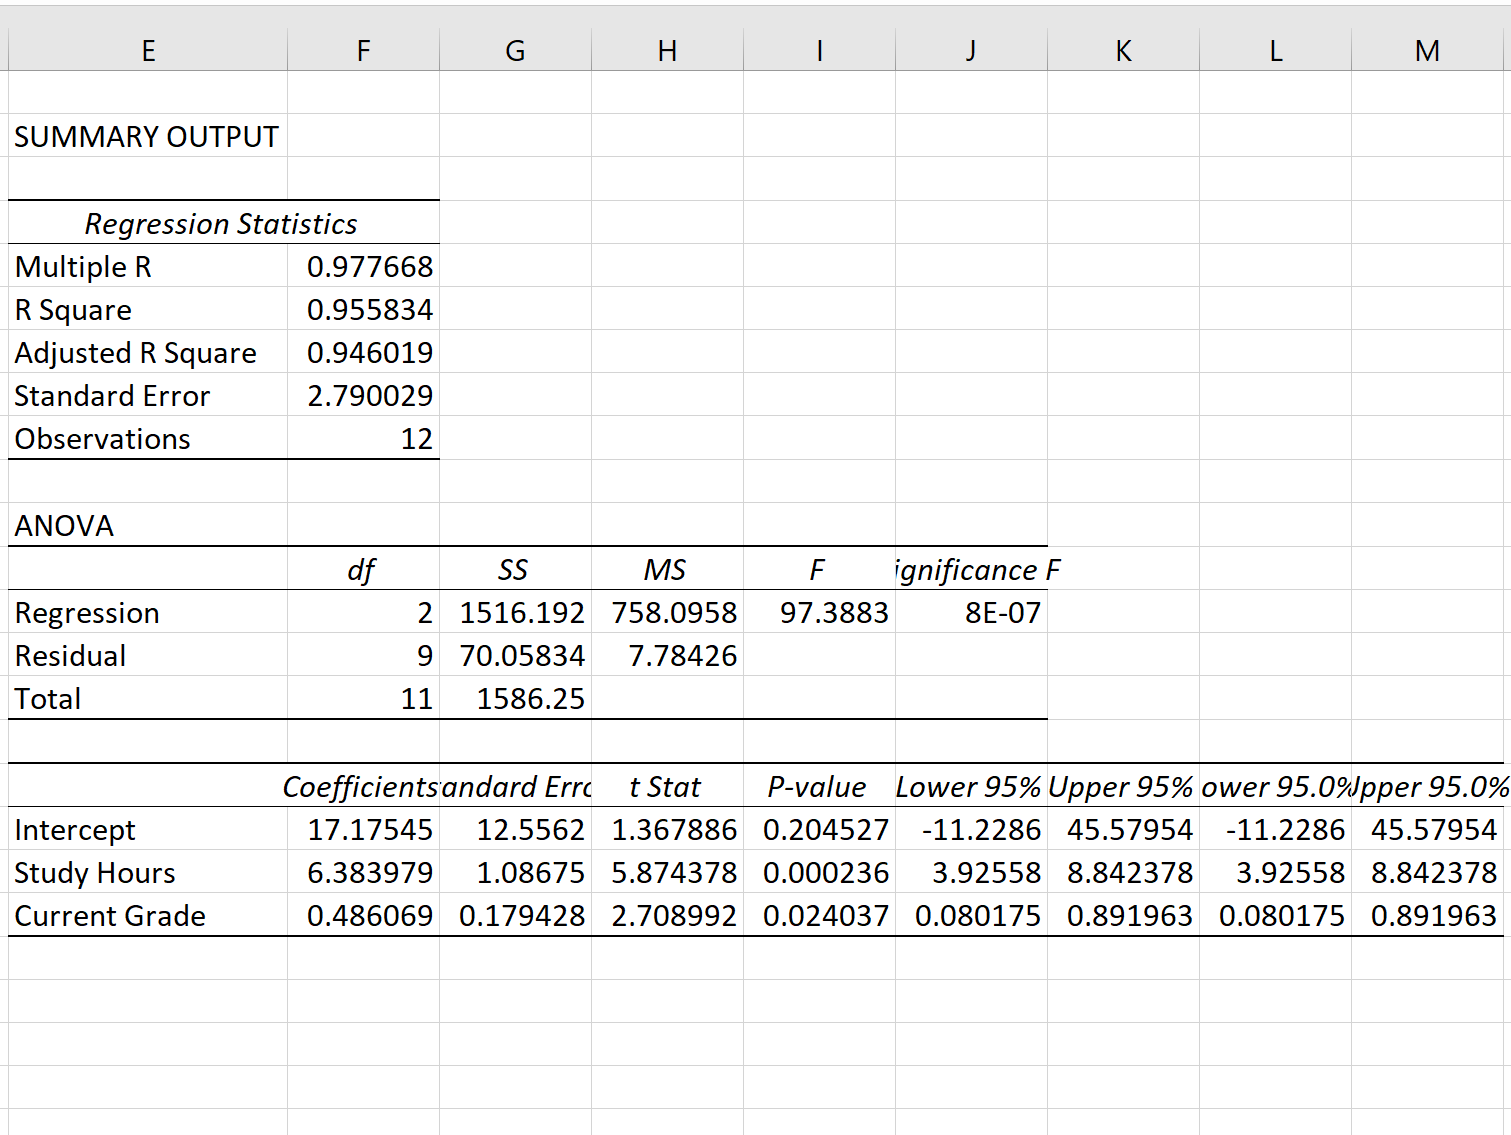
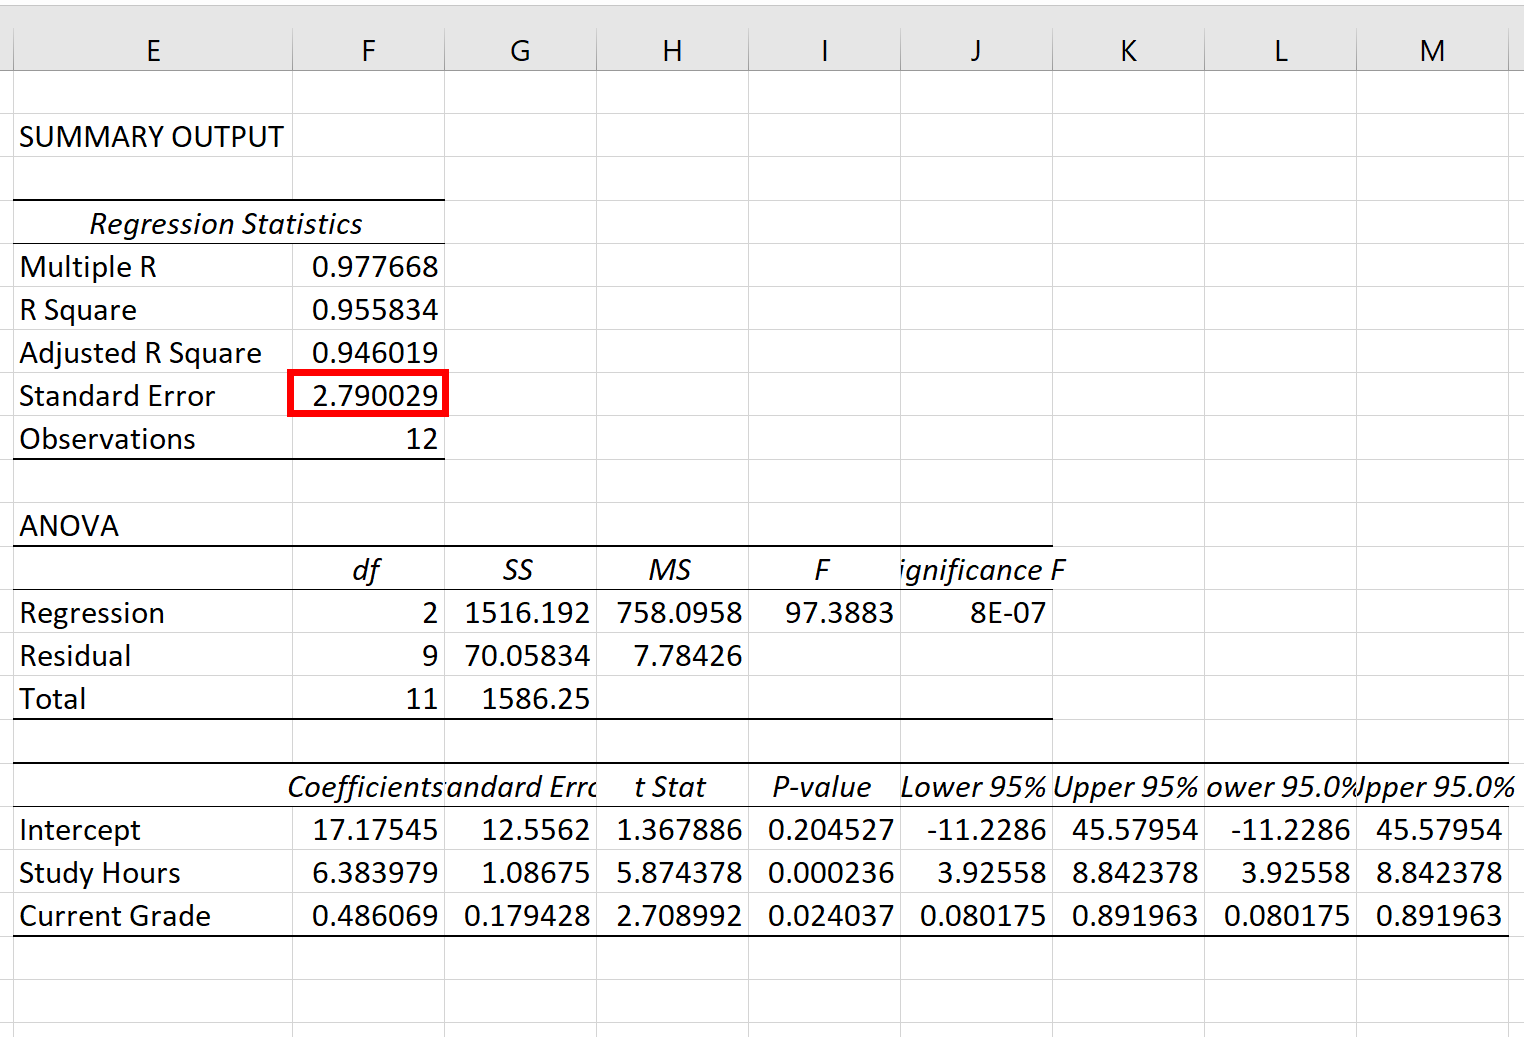
Once you click OK, the output of the regression model will appear:
Step 3: Interpret the Standard Error of Regression
The standard error of the regression model is the number next to Standard Error:
The standard error of this particular regression model turns out to be 2.790029.
This number represents the average distance between the actual exam scores and the exam scores predicted by the model.
Note that some of the exam scores will be further than 2.79 units away from the predicted score while some will be closer. But, on average, the distance between the actual exam scores and the predicted scores is 2.790029.
Also note that a smaller standard error of regression indicates that a regression model fits a dataset more closely.
Thus, if we fit a new regression model to the dataset and ended up with a standard error of, say, 4.53, this new model would be worse at predicting exam scores than the previous model.
Additional Resources
Another common way to measure the precision of a regression model is to use R-squared. Check out this article for a nice explanation of the benefits of using the standard error of the regression to measure precision compared to R-squared.


