The standard error of the estimate is a way to measure the accuracy of the predictions made by a regression model.
Often denoted σest, it is calculated as:
σest = √Σ(y – ŷ)2/n
where:
- y: The observed value
- ŷ: The predicted value
- n: The total number of observations
The standard error of the estimate gives us an idea of how well a regression model fits a dataset. In particular:
- The smaller the value, the better the fit.
- The larger the value, the worse the fit.
For a regression model that has a small standard error of the estimate, the data points will be closely packed around the estimated regression line:

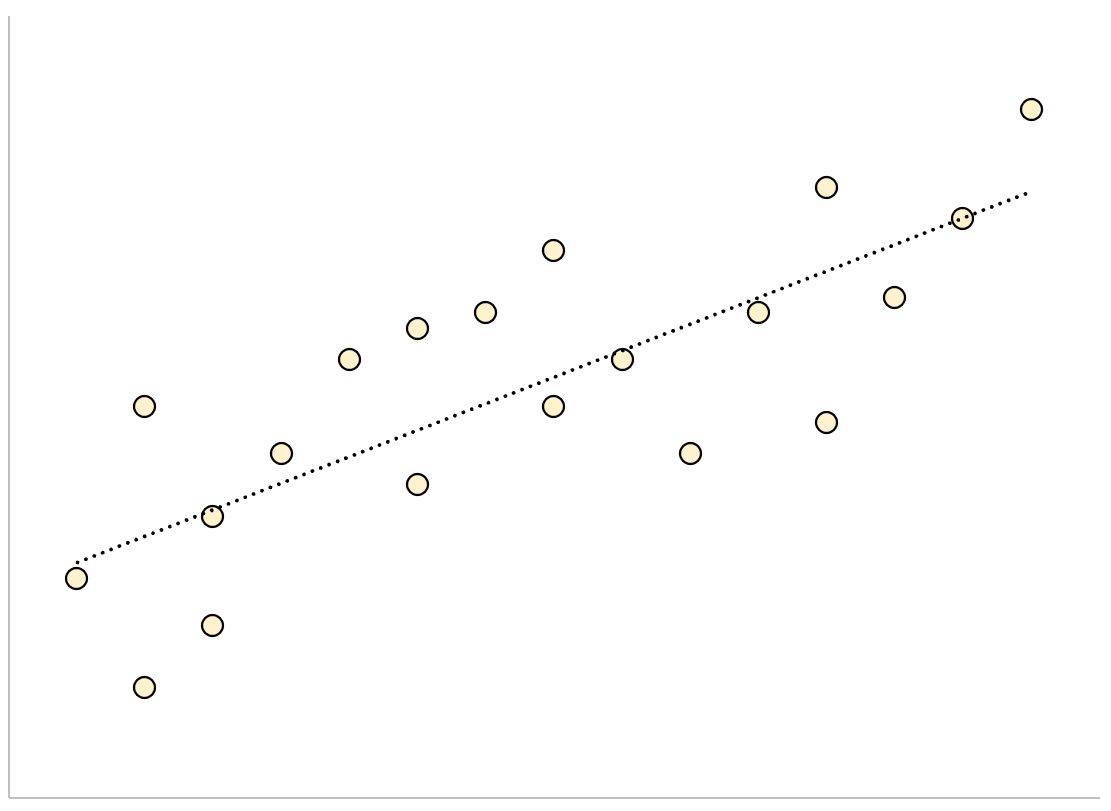
Conversely, for a regression model that has a large standard error of the estimate, the data points will be more loosely scattered around the regression line:
The following example shows how to calculate and interpret the standard error of the estimate for a regression model in Excel.
Example: Standard Error of the Estimate in Excel
Use the following steps to calculate the standard error of the estimate for a regression model in Excel.
Step 1: Enter the Data
First, enter the values for the dataset:

Step 2: Perform Linear Regression
Next, click the Data tab along the top ribbon. Then click the Data Analysis option within the Analyze group.
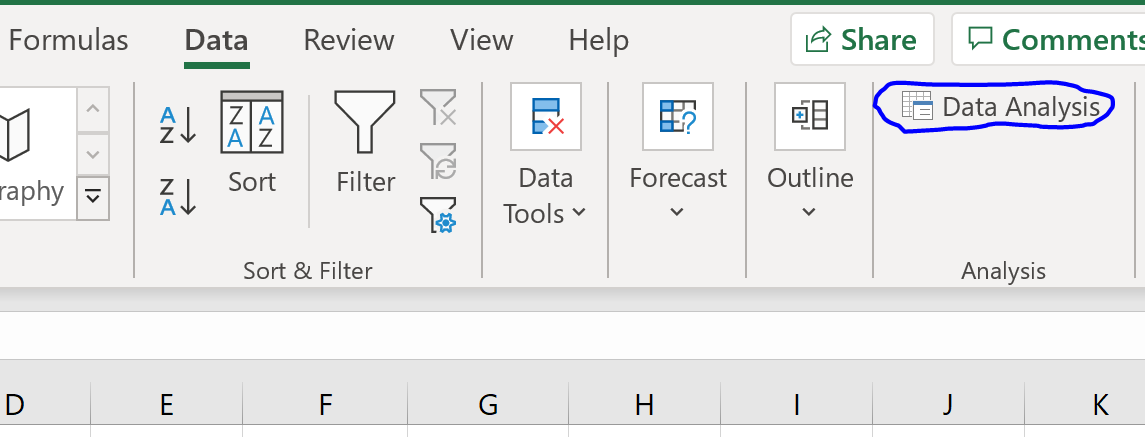
If you don’t see this option, you need to first load the Analysis ToolPak.
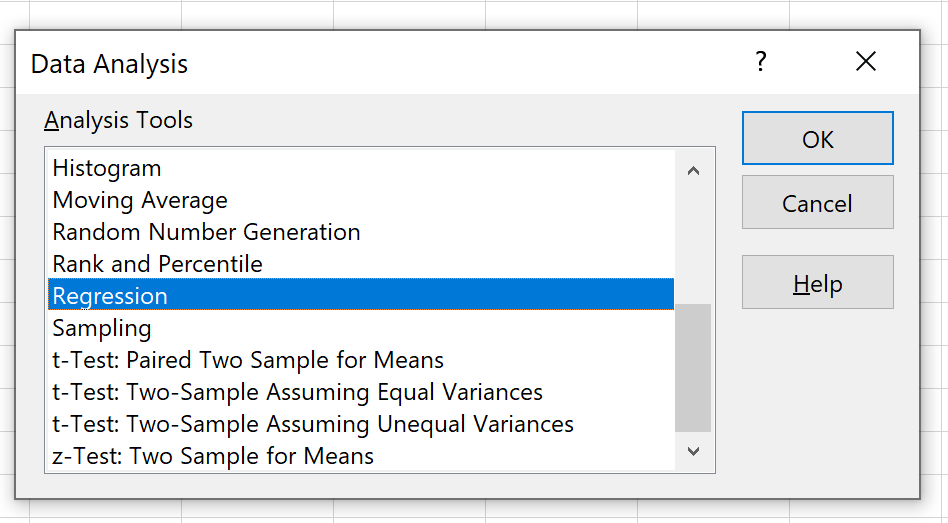
In the new window that appears, click Regression and then click OK.
In the new window that appears, fill in the following information:

Once you click OK, the regression output will appear:
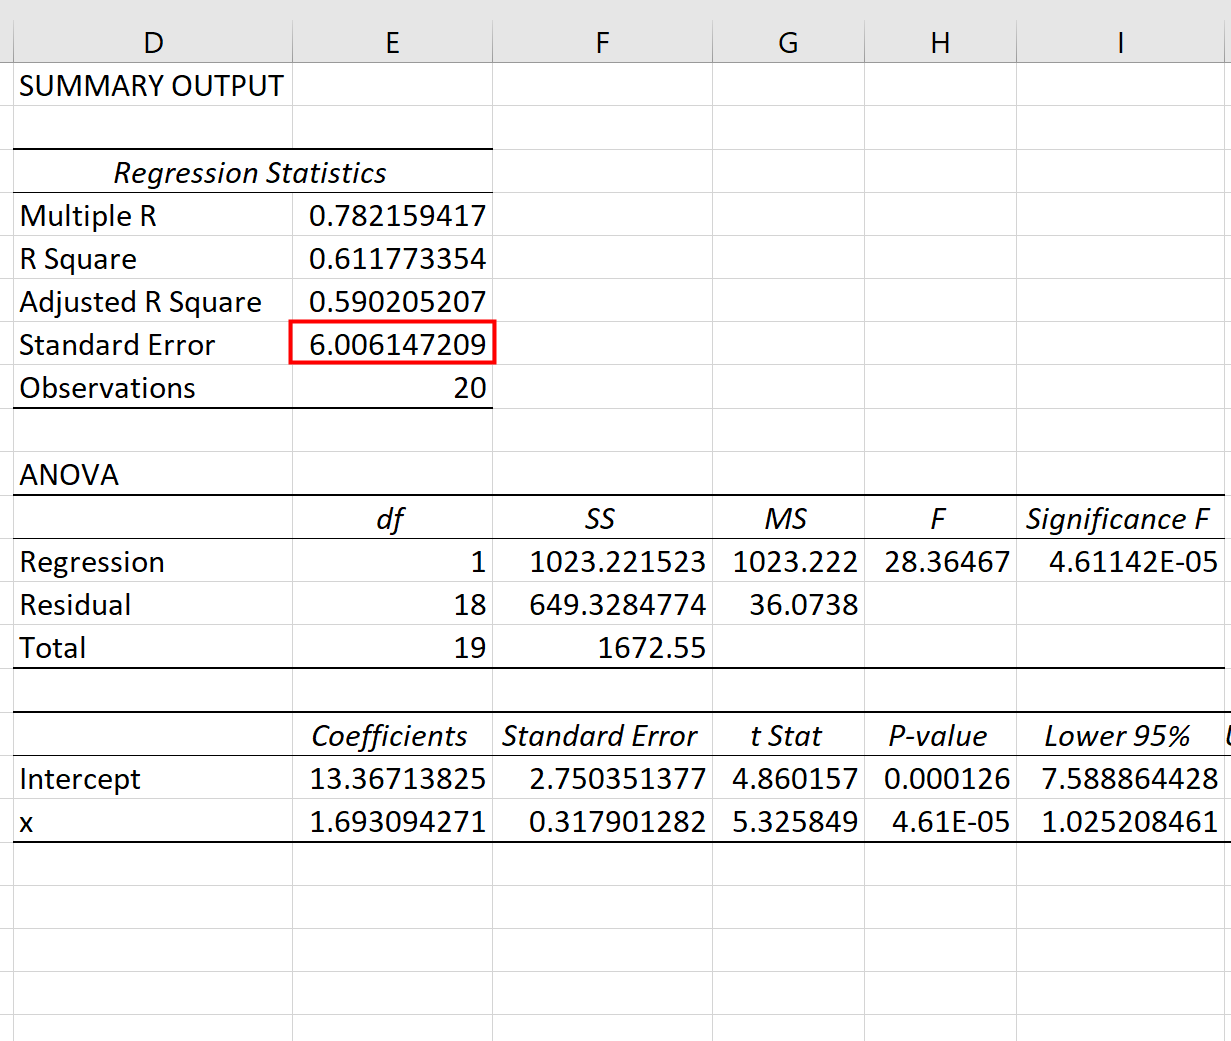
We can use the coefficients from the regression table to construct the estimated regression equation:
ŷ = 13.367 + 1.693(x)
And we can see that the standard error of the estimate for this regression model turns out to be 6.006. In simple terms, this tells us that the average data point falls 6.006 units from the regression line.
We can use the estimated regression equation and the standard error of the estimate to construct a 95% confidence interval for the predicted value of a certain data point.
For example, suppose x is equal to 10. Using the estimated regression equation, we would predict that y would be equal to:
ŷ = 13.367 + 1.693*(10) = 30.297
And we can obtain the 95% confidence interval for this estimate by using the following formula:
- 95% C.I. = [ŷ – 1.96*σest, ŷ + 1.96*σest]
For our example, the 95% confidence interval would be calculated as:
- 95% C.I. = [ŷ – 1.96*σest, ŷ + 1.96*σest]
- 95% C.I. = [30.297 – 1.96*6.006, 30.297 + 1.96*6.006]
- 95% C.I. = [18.525, 42.069]
Additional Resources
How to Perform Simple Linear Regression in Excel
How to Perform Multiple Linear Regression in Excel
How to Create a Residual Plot in Excel