Simple linear regression is a technique that we can use to understand the relationship between one predictor variable and a response variable.
This technique finds a line that best “fits” the data and takes on the following form:
ŷ = b0 + b1x
where:
- ŷ: The estimated response value
- b0: The intercept of the regression line
- b1: The slope of the regression line
This equation helps us understand the relationship between the predictor variable and the response variable.
The following step-by-step example shows how to perform simple linear regression in SAS.
Step 1: Create the Data
For this example, we’ll create a dataset that contains the total hours studied and final exam score for 15 students.
We’ll to fit a simple linear regression model using hours as the predictor variable and score as the response variable.
The following code shows how to create this dataset in SAS:
/*create dataset*/
data exam_data;
    input hours score;
    datalines;
1 64
2 66
4 76
5 73
5 74
6 81
6 83
7 82
8 80
10 88
11 84
11 82
12 91
12 93
14 89
;
run;

/*view dataset*/
proc print data=exam_data;
Step 2: Fit the Simple Linear Regression Model
Next, we’ll use proc reg to fit the simple linear regression model:
/*fit simple linear regression model*/
proc reg data=exam_data;
   model score = hours;
run;
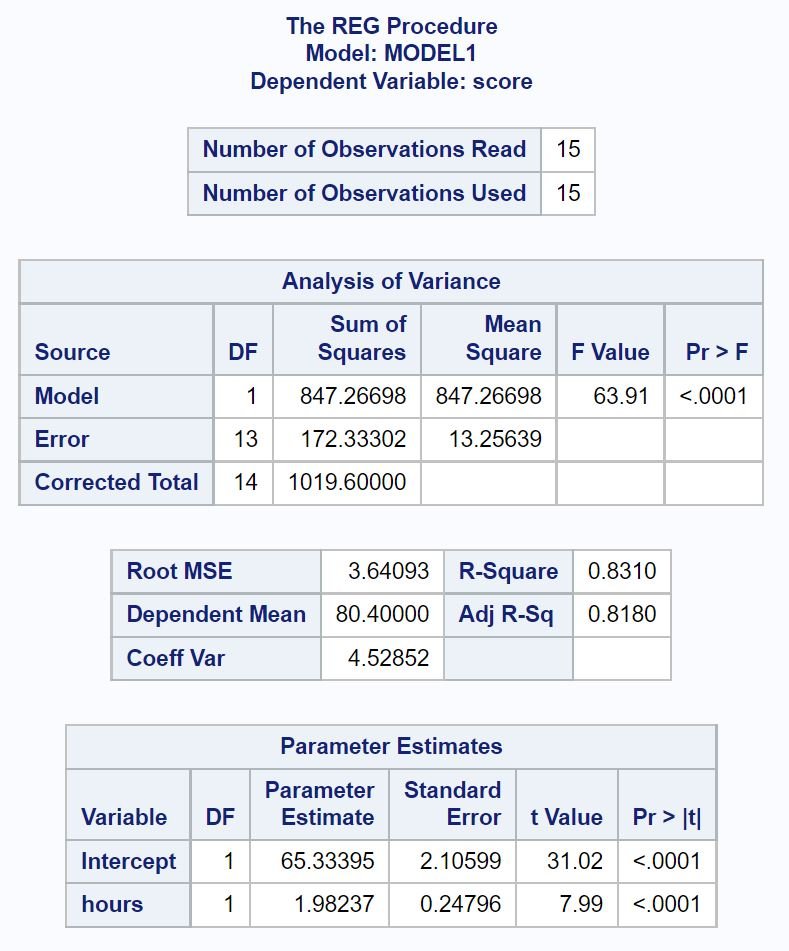
Here’s how to interpret the most important values from each table in the output:
Analysis of Variance Table:
The overall F-value of the regression model is 63.91 and the corresponding p-value is <.0001>.
Since this p-value is less than .05, we conclude that the regression model as a whole is statistically significant. In other words, hours is a useful variable for predicting exam score.
Model Fit Table:
The R-Square value tells us the percentage of variation in the exam scores that can be explained by the number of hours studied.
In general, the larger the R-squared value of a regression model the better the predictor variables are able to predict the value of the response variable.
In this case, 83.1% of the variation in exam scores can be explained by the number of hours studied. This value is quite high, which indicates that hours studied is a highly useful variable for predicting exam score.
Parameter Estimates Table:
From this table we can see the fitted regression equation:
Score = 65.33 + 1.98*(hours)
We interpret this to mean that each additional hour studied is associated with an average increase of 1.98 points in exam score.
The intercept value tells us that the average exam score for a student who studies zero hours is 65.33.
We can also use this equation to find the expected exam score based on the number of hours that a student studies.
For example, a student who studies for 10 hours is expected to receive an exam score of 85.13:
Score = 65.33 + 1.98*(10) = 85.13
Since the p-value (<.0001 for>hours is less than .05 in this table, we conclude that it’s a statistically significant predictor variable.
Step 3: Analyze the Residual Plots
Simple linear regression makes two important assumptions about the residuals of the model:
- The residuals are normally distributed.
- The residuals have equal variance (“homoscedasticity“) at each level of the predictor variable.
If these assumptions are violated, then the results of our regression model can be unreliable.
To verify that these assumptions are met, we can analyze the residual plots that SAS automatically in the output:
To verify that the residuals are normally distributed, we can analyze the plot in the left position of the middle row with “Quantile” along the x-axis and “Residual” along the y-axis.
This plot is called a Q-Q plot, short for “quantile-quantile” plot, and is used to determine whether or not data is normally distributed. If the data is normally distributed, the points in a Q-Q plot will lie on a straight diagonal line.
From the plot we can see that the points fall roughly along a straight diagonal line, so we can assume that the residuals are normally distributed.
Next, to verify that the residuals are homoscedastic we can look at the plot in the left position of the first row with “Predicted Value” along the x-axis and “Residual” along the y-axis.
If the points in the plot are scattered randomly about zero with no clear pattern then we can assume that the residuals are homoscedastic.
From the plot we can see that the points are scattered about zero randomly with roughly equal variance at each level throughout the plot so we can assume that the residuals are homoscedastic.
Since both assumptions are met, we can assume that the results of the simple linear regression model are reliable.
Additional Resources
The following tutorials explain how to perform other common tasks in SAS:
How to Perform a One-Way ANOVA in SAS
How to Perform a Two-Way ANOVA in SAS
How to Calculate Correlation in SAS


