To add a title to a single seaborn plot, you can use the .set() function.
For example, here’s how to add a title to a boxplot:
sns.boxplot(data=df, x='var1', y='var2').set(title='Title of Plot')
To add an overall title to a seaborn facet plot, you can use the .suptitle() function.
For example, here’s how to add an overall title to a relplot:
#define relplot
rel = sns.relplot(data=df, x='var1', y='var2', col='var3')

#add overall title to replot
rel.fig.suptitle('Overall Title')
The following examples show how to use these functions in practice.
Example 1: Add a Title to a Single Seaborn Plot
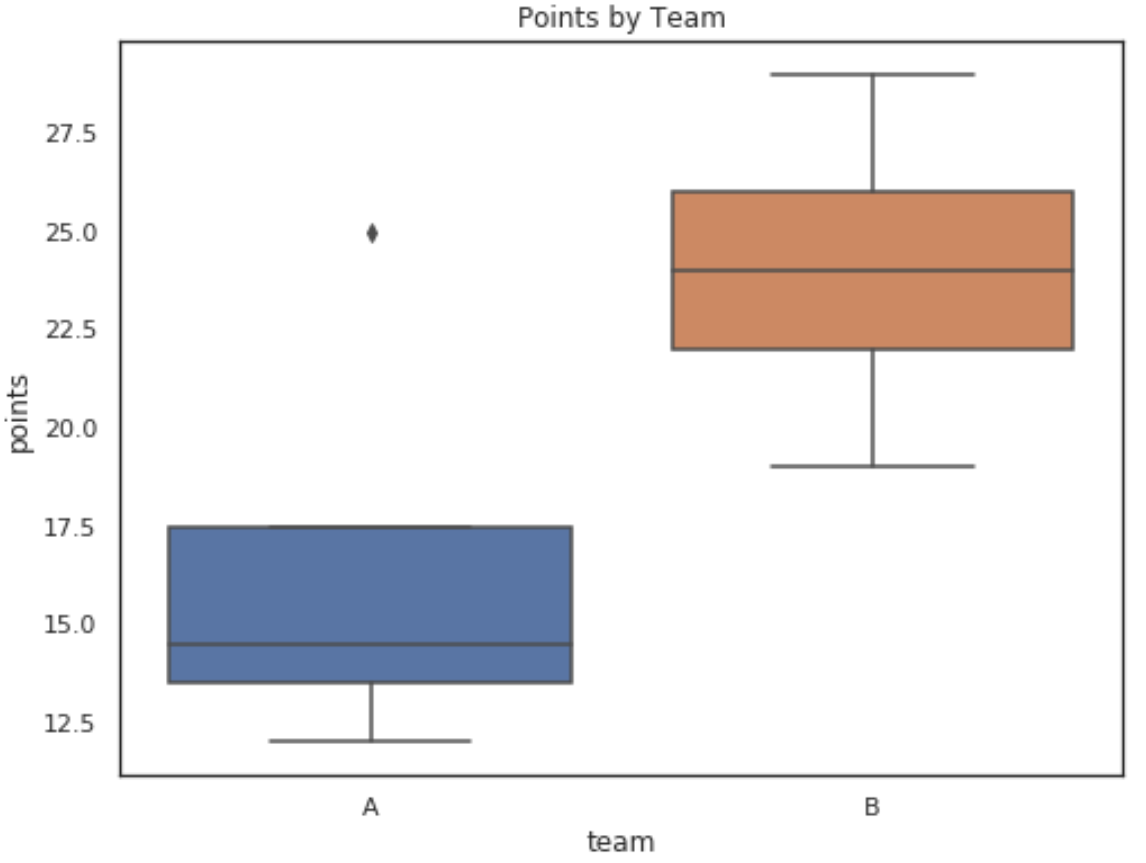
The following code shows how to add a title to a seaborn boxplot:
import pandas as pd
import seaborn as sns
import matplotlib.pyplot as plt

#create fake data
df = pd.DataFrame({'points': [25, 12, 15, 14, 19, 23, 25, 29],
                   'assists': [5, 7, 7, 9, 12, 9, 9, 4],
                   'team': ['A', 'A', 'A', 'A', 'B', 'B', 'B', 'B']})

#create boxplot
sns.boxplot(data=df, x='team', y='points').set(title='Points by Team')
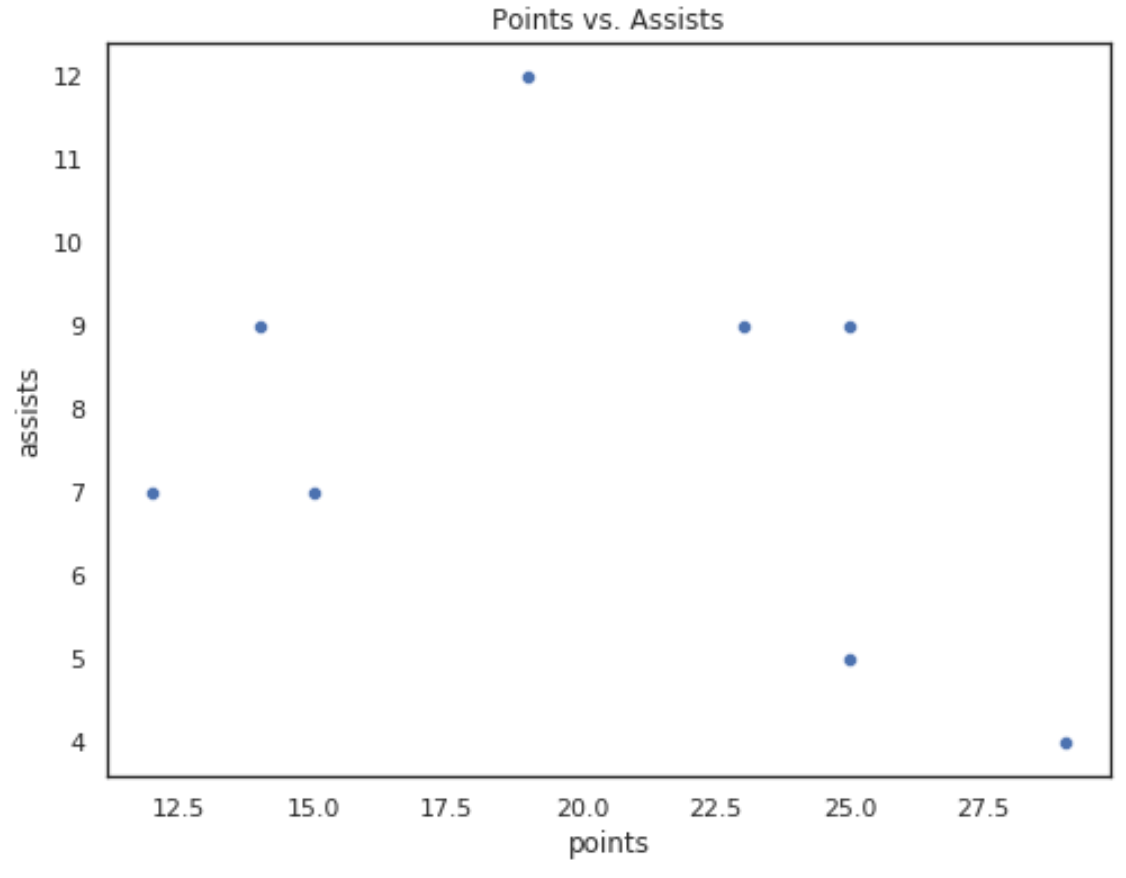
And the following code shows how to add a title to a seaborn scatterplot:
sns.scatterplot(data=df, x='points', y='assists').set(title='Points vs. Assists')
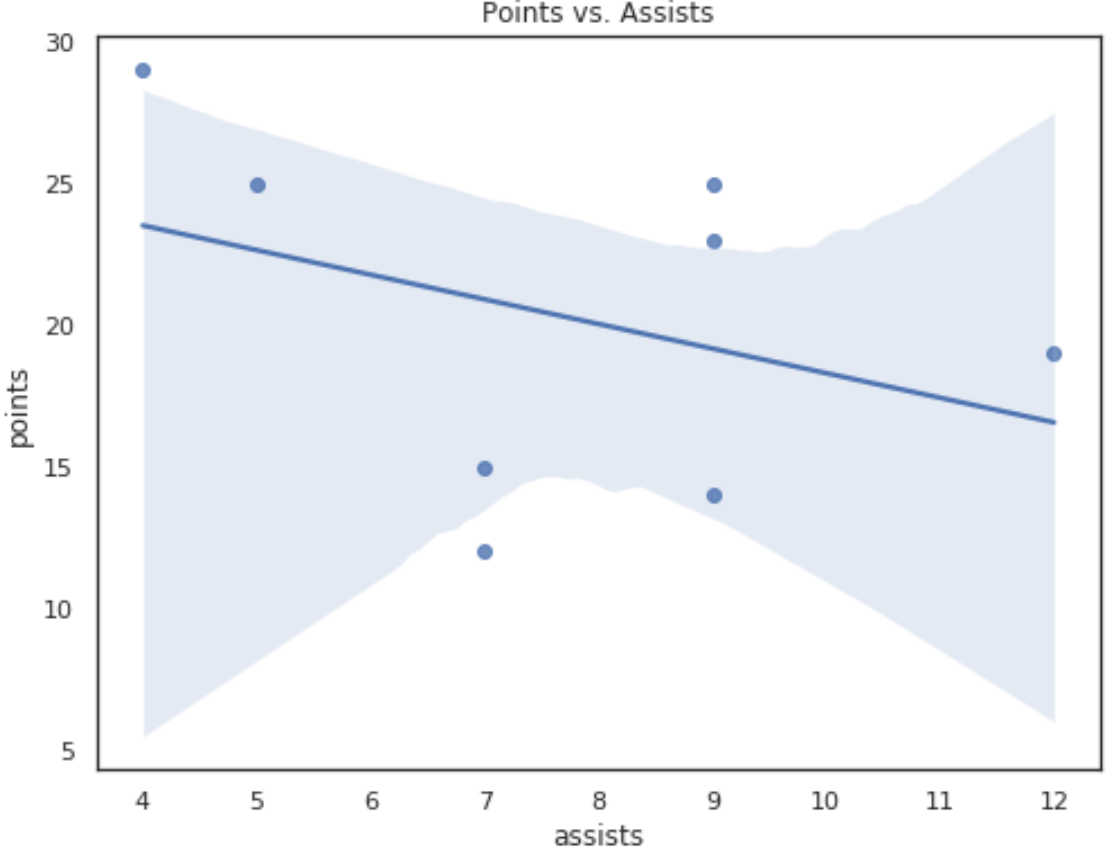
And the following code shows how to add a title to a seaborn regplot:
sns.regplot(data=df, x='points', y='assists').set(title='Points vs. Assists')
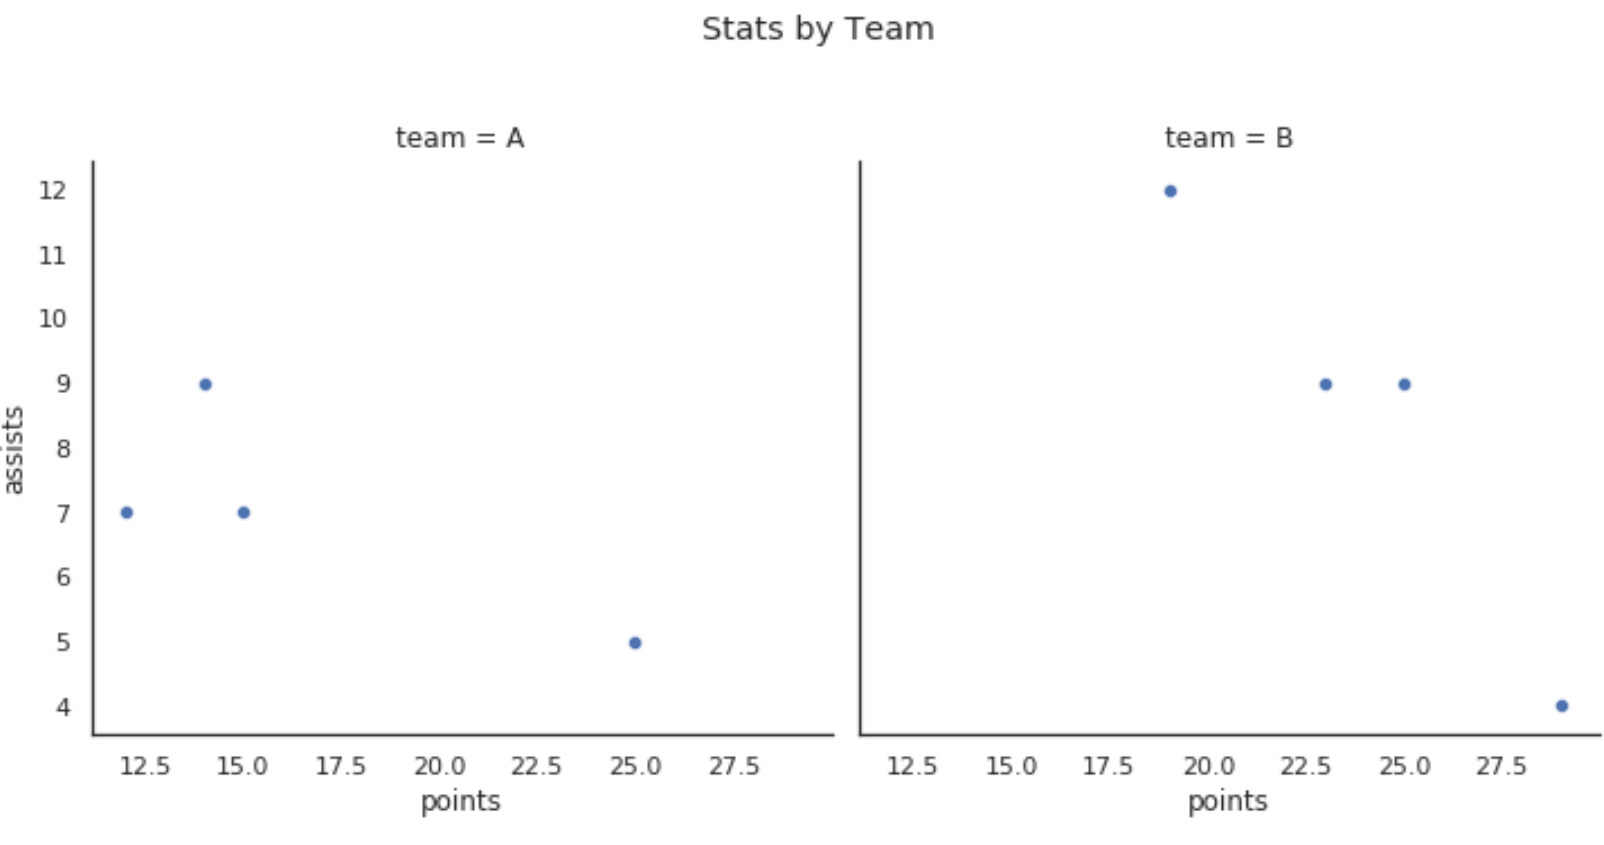
Example 2: Add an Overall Title to a Seaborn Face Plot
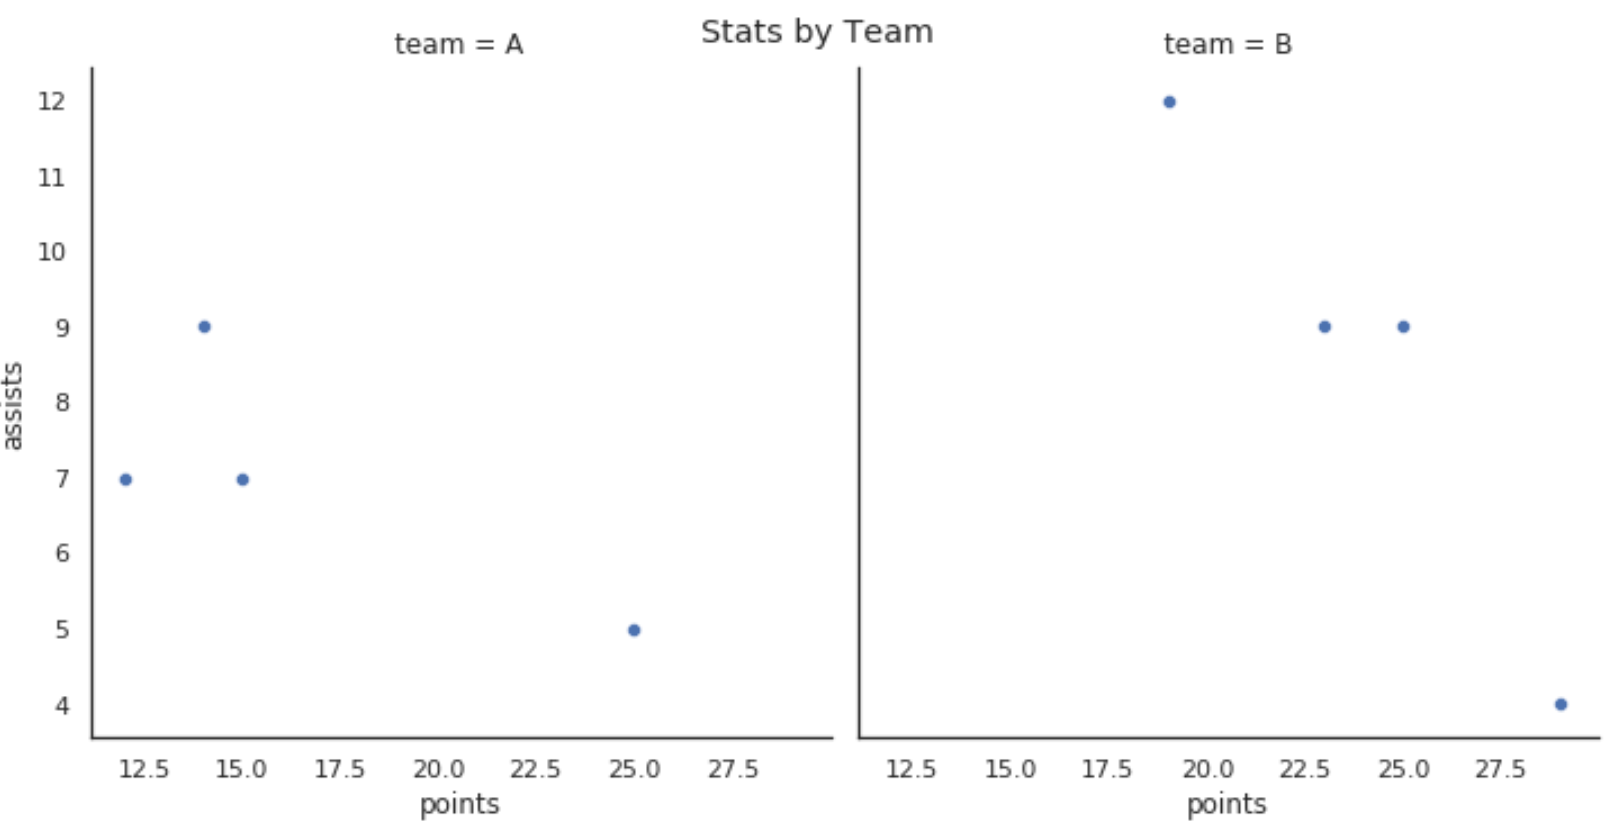
The following code shows how to add a title to a seaborn facet plot:
import pandas as pd
import seaborn as sns
import matplotlib.pyplot as plt

#create fake data
df = pd.DataFrame({'points': [25, 12, 15, 14, 19, 23, 25, 29],
                   'assists': [5, 7, 7, 9, 12, 9, 9, 4],
                   'team': ['A', 'A', 'A', 'A', 'B', 'B', 'B', 'B']})

#create relplot
rel = sns.relplot(data=df, x='points', y='assists', col='team')

#add overall title
rel.fig.suptitle('Stats by Team')
We can also use the subplots_adjust() argument to move the overall title slightly higher so that it doesn’t get in the way of the individual plots:
#create relplot
rel = sns.relplot(data=df, x='points', y='assists', col='team')

#move overall title up
rel.fig.subplots_adjust(top=.8)

#add overall title
rel.fig.suptitle('Stats by Team')
Additional Resources
How to Adjust the Figure Size of a Seaborn Plot
How to Change the Position of a Legend in Seaborn
How to Change Axis Labels on a Seaborn Plot