The easiest way to add a table to a seaborn plot is to use the table() function from Matplotlib.
The following example shows how to use this function in practice.
Example: How to Add Table to Seaborn Plot
Suppose we have the following pandas DataFrame that contains information about basketball players on various teams:
import pandas as pd

#create DataFrame
df = pd.DataFrame({'team': ['A', 'A', 'A', 'B', 'B', 'B', 'C', 'C', 'C'],
                   'points': [18, 22, 19, 14, 14, 11, 20, 28, 30],
                   'assists': [5, 7, 7, 9, 12, 9, 9, 4, 15]})

#view DataFrame
print(df)

  team  points  assists
0    A      18        5
1    A      22        7
2    A      19        7
3    B      14        9
4    B      14       12
5    B      11        9
6    C      20        9
7    C      28        4
8    C      30       15
The following code shows how to create a scatterplot in seaborn and use the table() function from Matplotlib to add a table below the plot that shows the raw data values:
import seaborn as sns
import matplotlib.pyplot as plt

#create scatterplot of assists vs points
sns.scatterplot(data=df, x='assists', y='points', hue='team')

#add table below scatterplot
table = plt.table(cellText=df.values,
                  rowLabels=df.index,
                  colLabels=df.columns,
                  bbox=(.2, -.7, 0.5, 0.5))

#display final plot
plt.show()
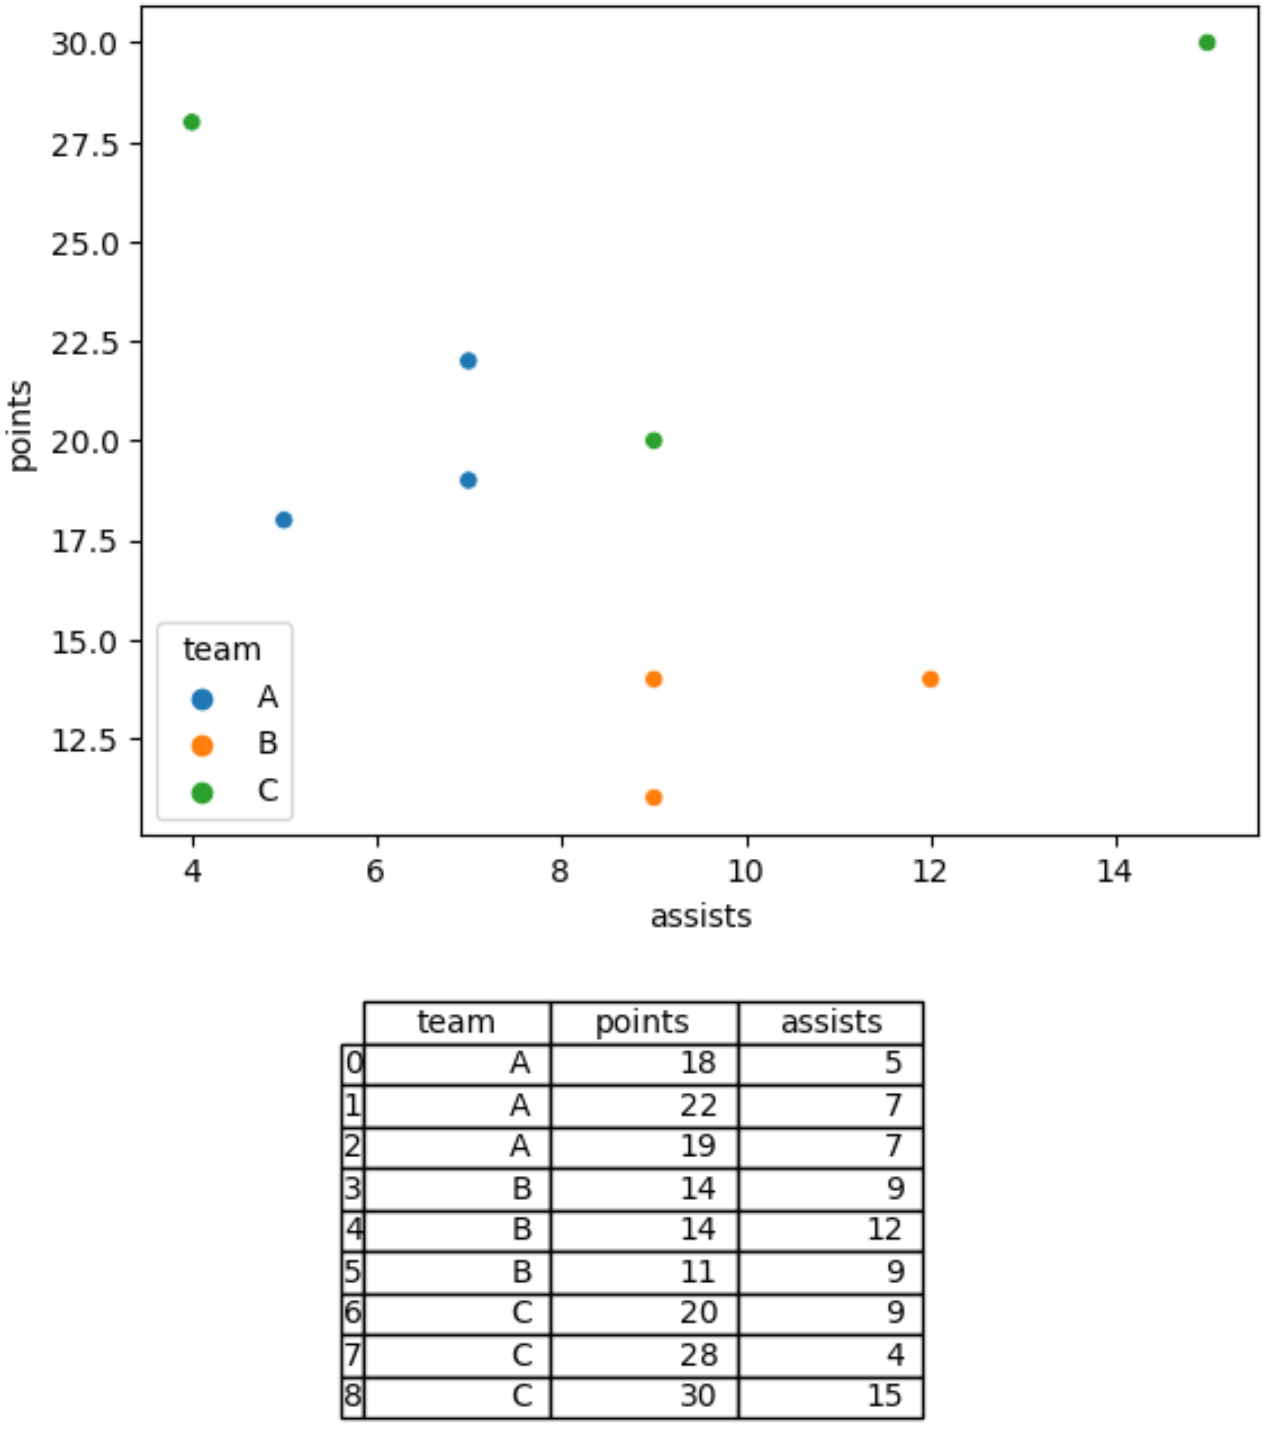
The table below the plot shows the raw data values represented in the scatterplot.
The bbox argument within the table() function controls the location of the table.
The bbox argument accepts four values to specify the left, top, right, and bottom padding on the table.
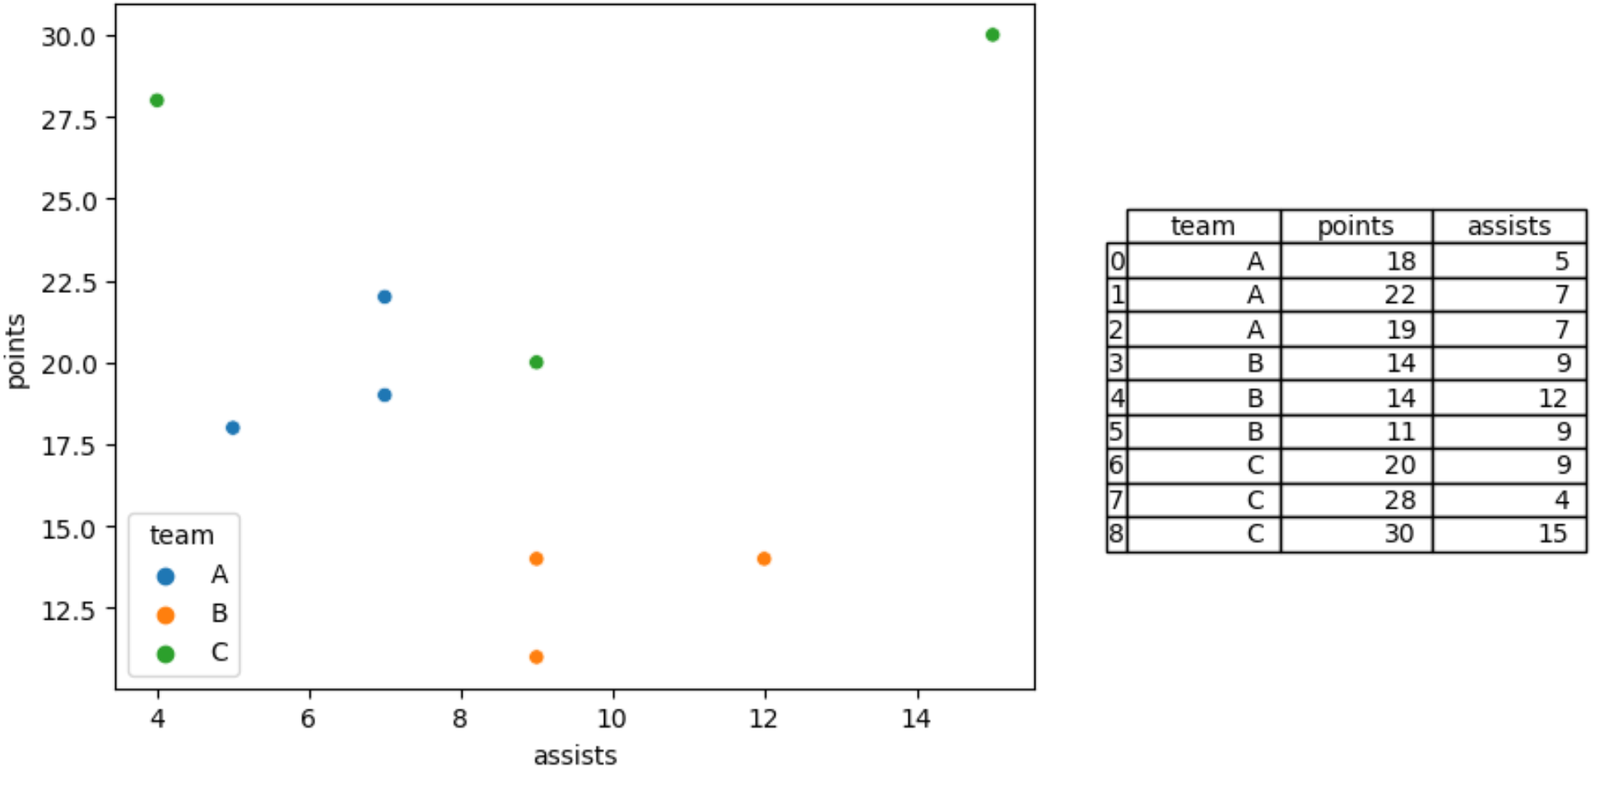
We can adjust the values in the bbox argument to instead place the table on the right side of the plot:
import seaborn as sns
import matplotlib.pyplot as plt

#create scatterplot of assists vs points
sns.scatterplot(data=df, x='assists', y='points', hue='team')

#add table to the right of the scatterplot
table = plt.table(cellText=df.values,
                  rowLabels=df.index,
                  colLabels=df.columns,
                  bbox=(1.1, .2, 0.5, 0.5))

#display final plot
plt.show()
Feel free to play around with the values to get the table in the exact location you’d like.
Note: You can find the complete documentation for the Matplotlib table() function here.
Additional Resources
The following tutorials explain how to perform other common tasks using seaborn:
How to Add a Title to Seaborn Plots
How to Change Font Size in Seaborn Plots
How to Adjust Number of Ticks in Seaborn Plots