You can use the following basic syntax to create subplots in the seaborn data visualization library in Python:
#define dimensions of subplots (rows, columns)
fig, axes = plt.subplots(2, 2)

#create chart in each subplot
sns.boxplot(data=df, x='team', y='points', ax=axes[0,0])
sns.boxplot(data=df, x='team', y='assists', ax=axes[0,1])

...
The following example shows how to use this syntax in practice.
Example: Creating Subplots in Seaborn
Suppose we have the following pandas DataFrame:
import pandas as pd

#create DataFrame
df = pd.DataFrame({'team': ['A', 'A', 'A', 'A', 'B', 'B', 'B', 'B'],
                   'points': [19, 12, 15, 14, 19, 23, 25, 29],
                   'assists': [13, 15, 11, 8, 6, 8, 11, 14],
                   'rebounds': [11, 7, 8, 12, 13, 7, 6, 8],
                   'blocks': [1, 2, 2, 3, 5, 4, 3, 3]})

#view DataFrame
print(df)

  team  points  assists  rebounds  blocks
0    A      19       13        11       1
1    A      12       15         7       2
2    A      15       11         8       2
3    A      14        8        12       3
4    B      19        6        13       5
5    B      23        8         7       4
6    B      25       11         6       3
7    B      29       14         8       3
The following code shows how to define a plotting region with two rows and two columns and create a boxplot in each subplot for each of the four numeric variables in the DataFrame:
import matplotlib.pyplot as plt
import seaborn as sns

#set seaborn plotting aesthetics as default
sns.set()

#define plotting region (2 rows, 2 columns)
fig, axes = plt.subplots(2, 2)

#create boxplot in each subplot
sns.boxplot(data=df, x='team', y='points', ax=axes[0,0])
sns.boxplot(data=df, x='team', y='assists', ax=axes[0,1])
sns.boxplot(data=df, x='team', y='rebounds', ax=axes[1,0])
sns.boxplot(data=df, x='team', y='blocks', ax=axes[1,1])
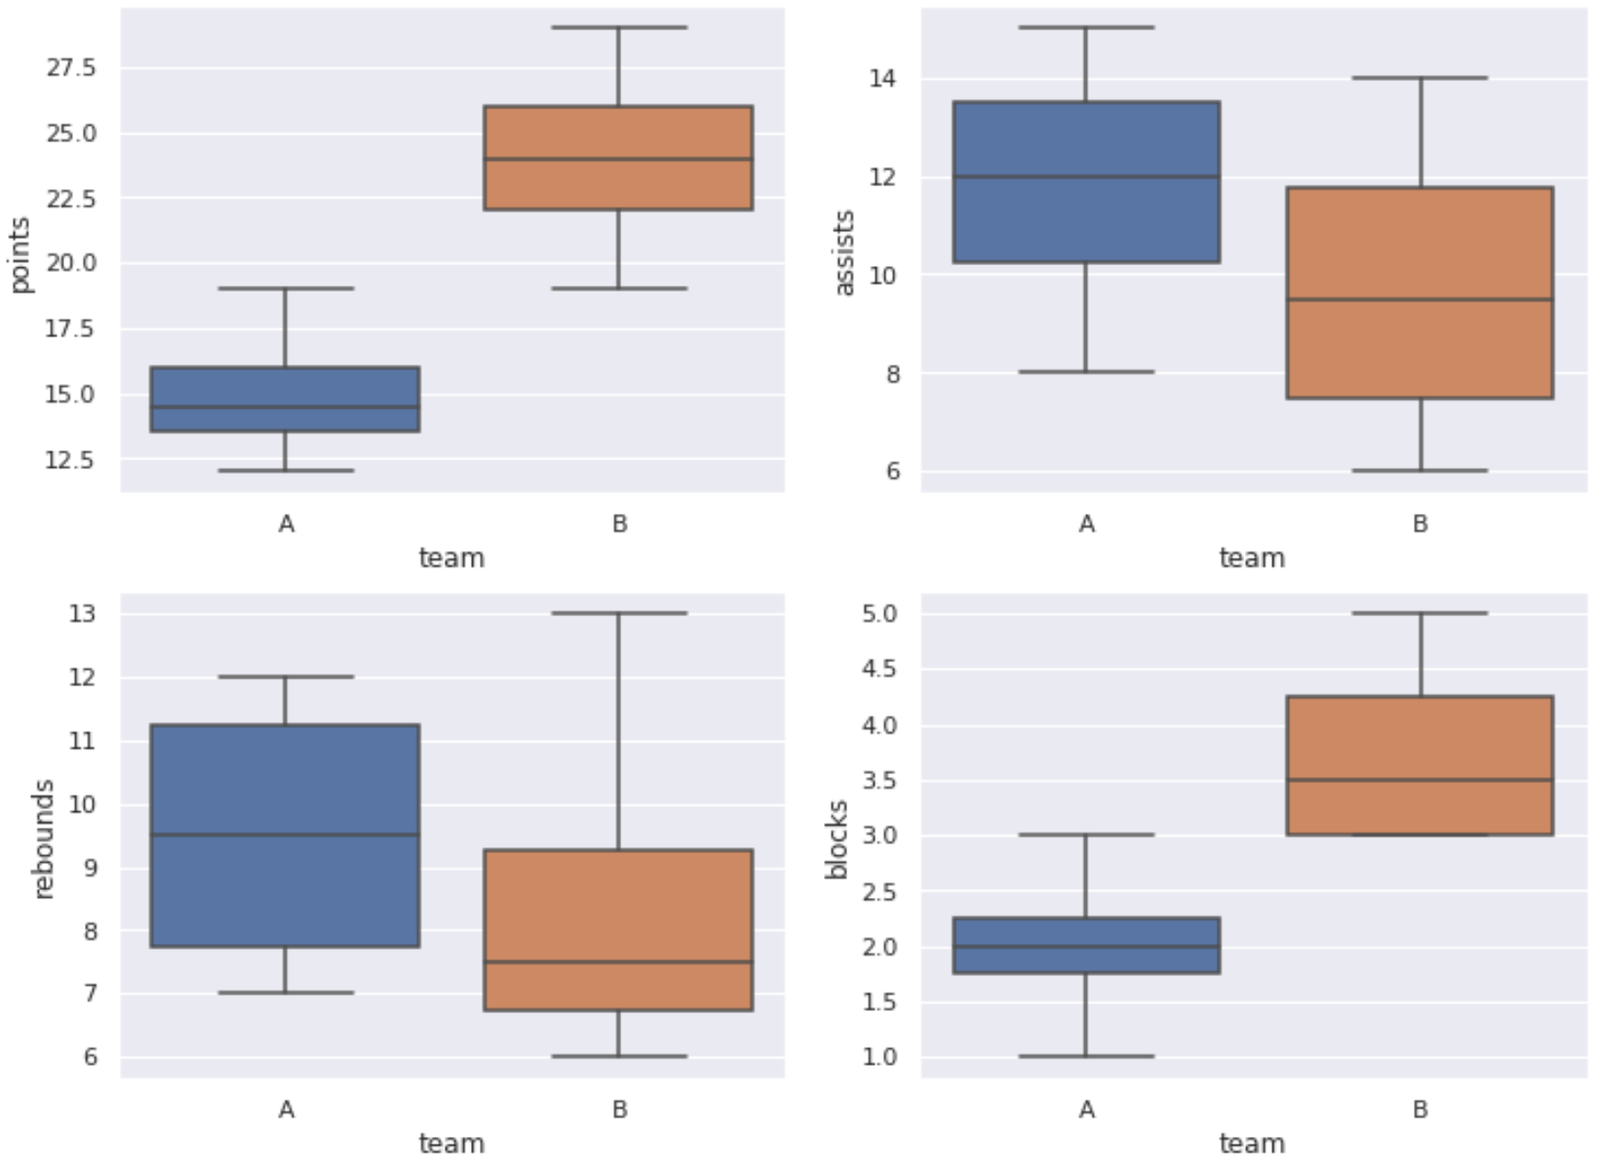
In this example, we created a plotting region with two rows and two columns and filled each subplot with boxplots.
However, we can use similar syntax to create a plotting region with different dimensions and fill in the subplots with different charts.
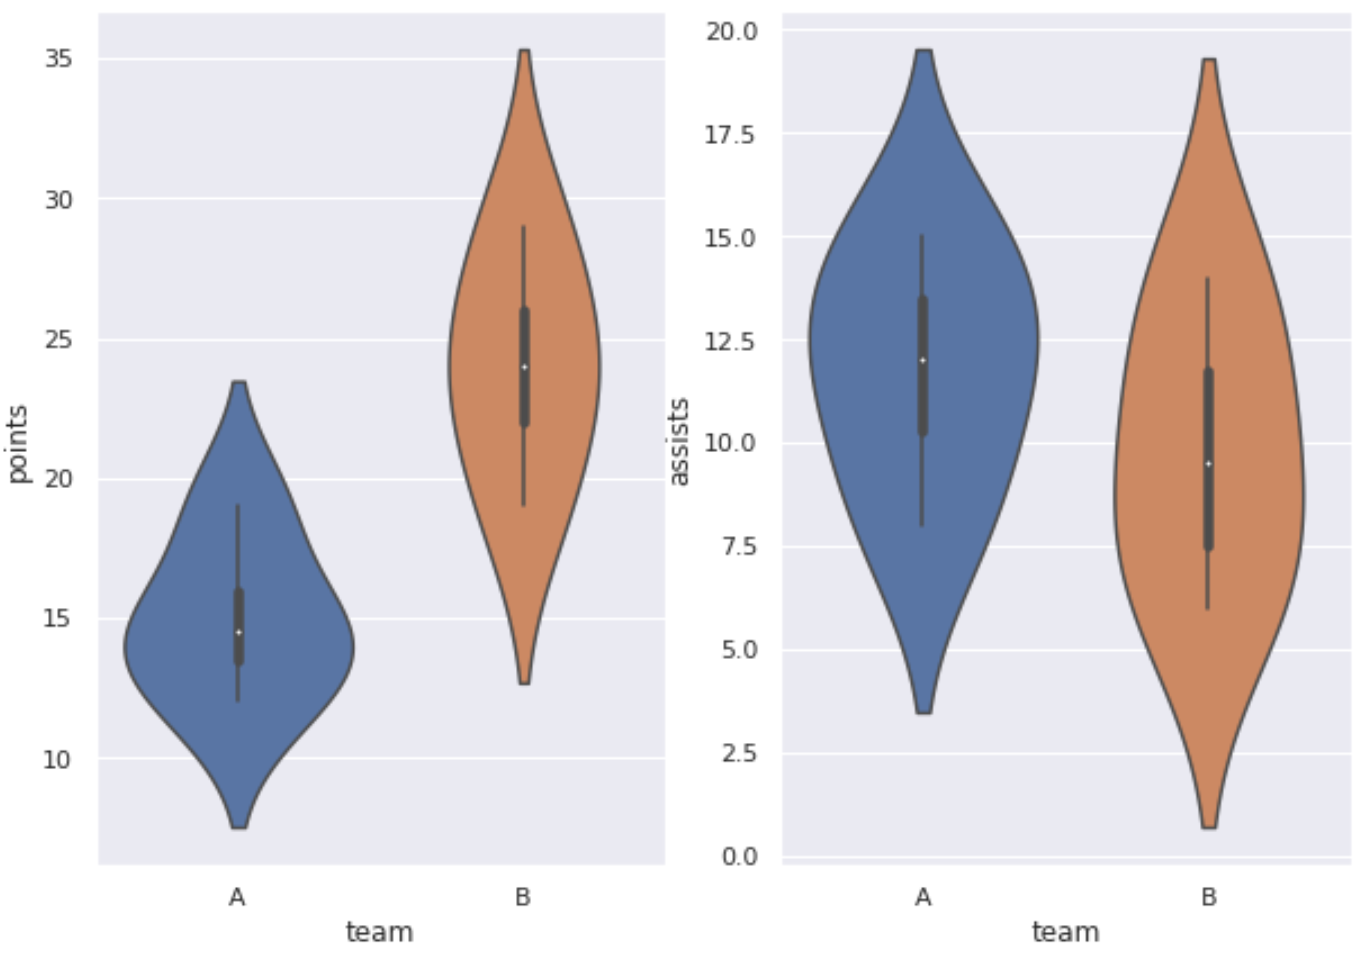
For example, the following code shows how to create a plotting region with one row and two columns and fill in each plot with a violin plot:
import matplotlib.pyplot as plt
import seaborn as sns

#set seaborn plotting aesthetics as default
sns.set()

#define plotting region (1 row, 2 columns)
fig, axes = plt.subplots(1, 2)

#create boxplot in each subplot
sns.violinplot(data=df, x='team', y='points', ax=axes[0])
sns.violinplot(data=df, x='team', y='assists', ax=axes[1])
Additional Resources
The following tutorials explain how to perform other common functions in seaborn:
How to Add a Title to Seaborn Plots
How to Save Seaborn Plot to a File
How to Change the Position of a Legend in Seaborn