You can use the linewidth argument within the lineplot() function to adjust the line thickness in seaborn plots:
import seaborn as sns

sns.lineplot(data=df, x='x_var', y='y_var', linewidth=2)
The greater the value you provide, the thicker the line will be.
The following example shows how to use this syntax in practice.
Example: Adjust Line Thickness in Seaborn
Suppose we have the following pandas DataFrame that contains information about the sales made each day at some retail store:
import pandas as pd

#create DataFrame
df = pd.DataFrame({'day': [1, 2, 3, 4, 5, 6, 7, 8, 9, 10],
                   'sales': [3, 3, 5, 4, 5, 6, 8, 9, 14, 18]})

#view DataFrame
print(df)

   day  sales
0    1      3
1    2      3
2    3      5
3    4      4
4    5      5
5    6      6
6    7      8
7    8      9
8    9     14
9   10     18
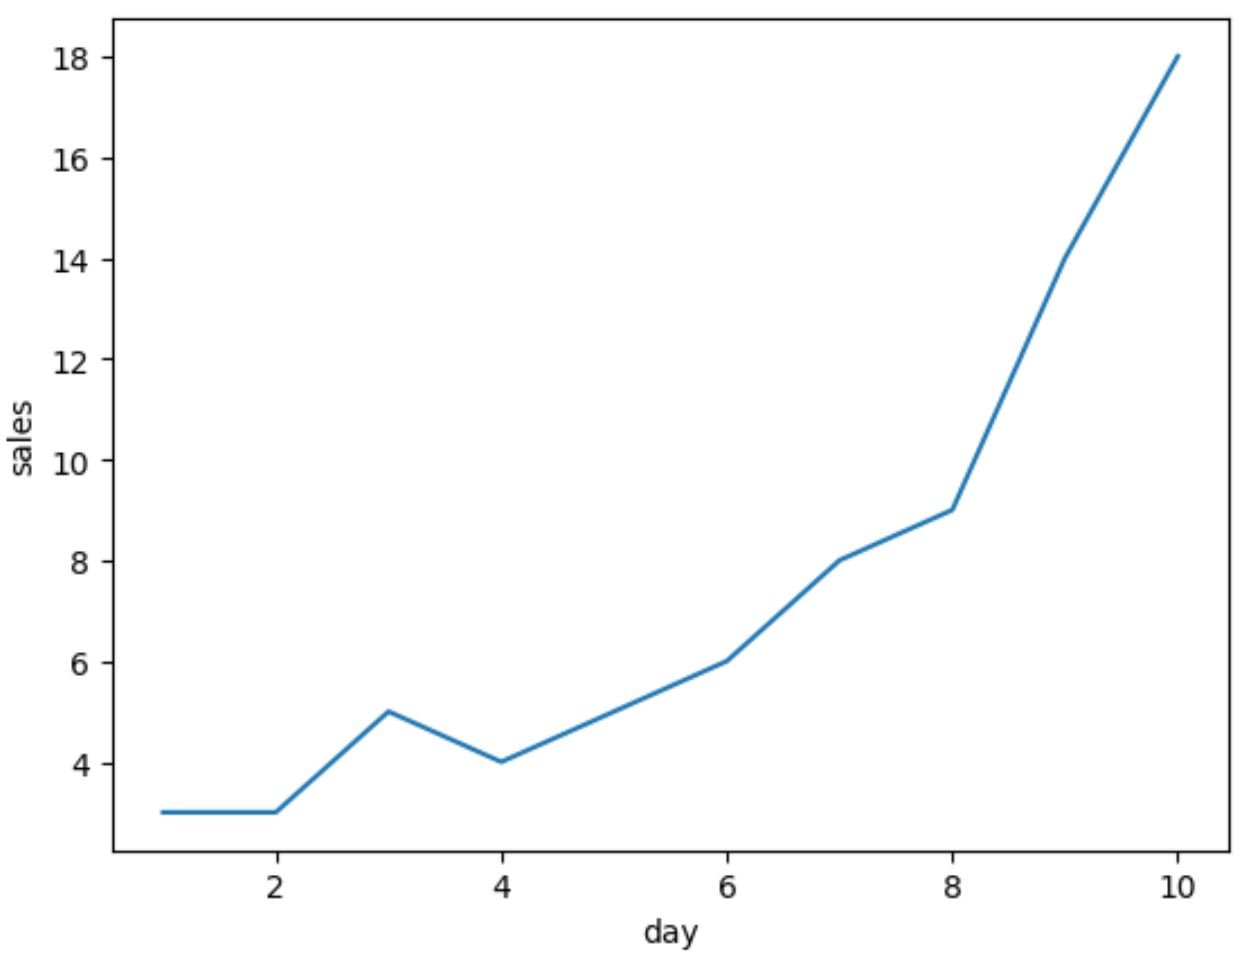
We can use the lineplot() function in seaborn to create a line plot with a default line width:
import seaborn as sns

#create line plot with default line width
sns.lineplot(data=df, x='day', y='sales')
To increase the line width, we can use the linewidth argument:
import seaborn as sns

#create line plot with increased line width
sns.lineplot(data=df, x='day', y='sales', linewidth=4)
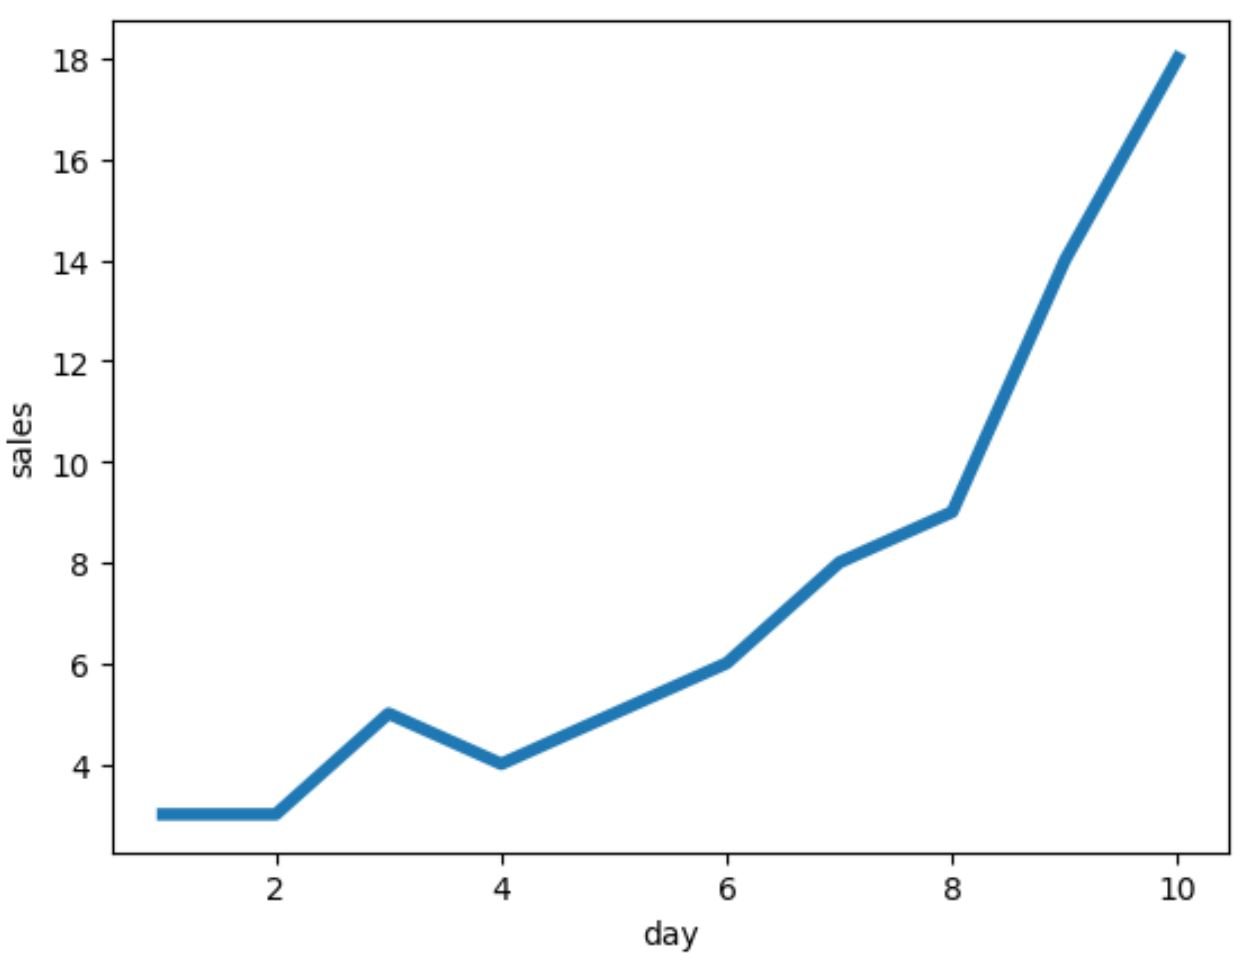
Notice that the line is much thicker in this plot.
Also note that you can use lw as shorthand for “linewidth” if you’d like:
import seaborn as sns

#create line plot with increased line width
sns.lineplot(data=df, x='day', y='sales', lw=4)
This produces the same result.
Also note that if you create a seaborn plot with multiple lines, the linewidth argument will affect the thickness of each line in the plot.
Note: If you have trouble importing seaborn in a Jupyter notebook, you may first need to run the command %pip install seaborn.
Additional Resources
The following tutorials explain how to perform other common tasks in seaborn:
How to Add a Title to Seaborn Plots
How to Change Font Size in Seaborn Plots
How to Adjust the Figure Size of a Seaborn Plot