You can use the following syntax to change the font size within a legend of a seaborn plot:
plt.legend(title='Team', fontsize='10', title_fontsize='14')
The fontsize argument specifies the font size for the labels in the legend and the title_fontsize specifies the font size for the title of the legend.
The following example shows how to use this function in practice.
Example: Changing Legend Font Size in a Seaborn Plot
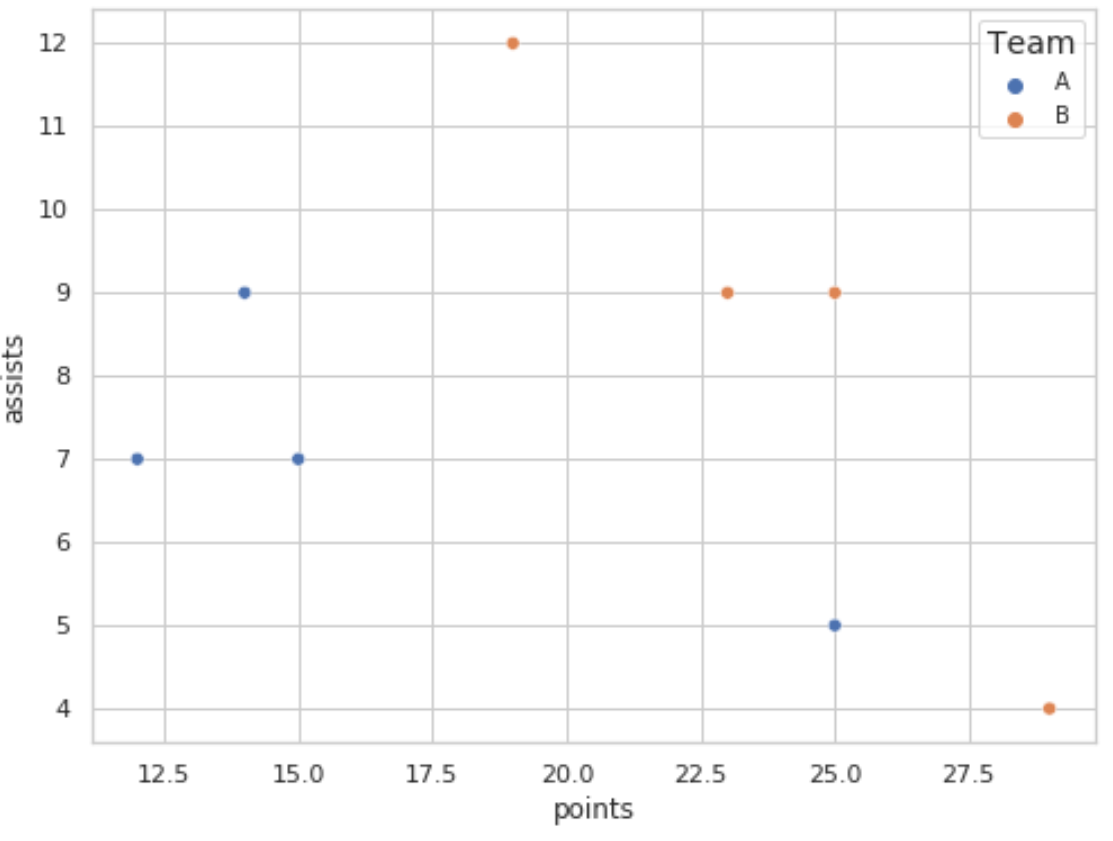
The following code shows how to create a scatterplot in Seaborn and specify the font size for both the labels and the title within the legend:
import pandas as pd
import seaborn as sns
import matplotlib.pyplot as plt
sns.set_style('whitegrid')

#create data
df = pd.DataFrame({'points': [25, 12, 15, 14, 19, 23, 25, 29],
                   'assists': [5, 7, 7, 9, 12, 9, 9, 4],
                   'team': ['A', 'A', 'A', 'A', 'B', 'B', 'B', 'B']})

#create scatterplot
sns.scatterplot(data=df, x='points', y='assists', hue='team')

#add legend
plt.legend(title='Team', fontsize='10', title_fontsize='14')
The font size arguments can also take on the following values:
- xx-small
- x-small
- small
- medium
- large
- x-large
- xx-large
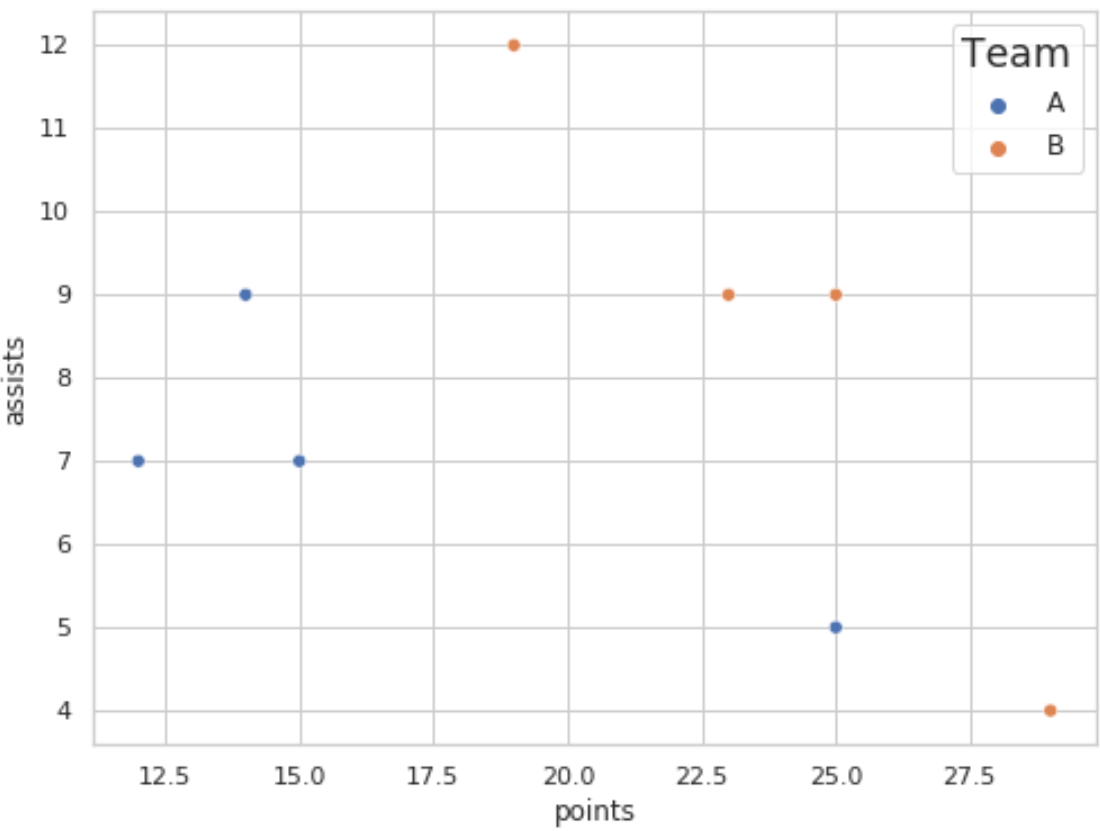
The following example shows how to use these arguments in practice:
import pandas as pd
import seaborn as sns
import matplotlib.pyplot as plt
sns.set_style('whitegrid')

#create fake data
df = pd.DataFrame({'points': [25, 12, 15, 14, 19, 23, 25, 29],
                   'assists': [5, 7, 7, 9, 12, 9, 9, 4],
                   'team': ['A', 'A', 'A', 'A', 'B', 'B', 'B', 'B']})

#create scatterplot
sns.scatterplot(data=df, x='points', y='assists', hue='team')

#add legend
plt.legend(title='Team', fontsize='medium', title_fontsize='x-large')
Reference the matplotlib documentation for an in-depth explanation of the plt.legend() function.
Additional Resources
The following tutorials explain how to perform other common tasks in seaborn:
How to Adjust the Figure Size of a Seaborn Plot
How to Change Axis Labels on a Seaborn Plot
How to Change the Position of a Legend in Seaborn
How to Place Legend Outside a Seaborn Plot