To change the position of a legend in a seaborn plot, you can use the plt.legend() command.
For example, you can use the following syntax to place the legend in the upper right corner of the plot:
plt.legend(loc='upper right')
The default location is “best” – which is where Matplotlib automatically finds a location for the legend based on where it avoids covering any data points.
However, you can specify any of the following legend locations:
- upper right
- upper left
- lower left
- lower right
- right
- center left
- center right
- lower center
- upper center
- center
You can also use the bbox_to_anchor() argument to place the legend outside of the plot. For example, you can use the following syntax to place the legend in the top right corner outside of the plot:
plt.legend(bbox_to_anchor=(1.05, 1), loc='upper left', borderaxespad=0)
The following examples show how to use each of these methods in practice.
Example 1: Change Legend Position Inside of Seaborn Plot
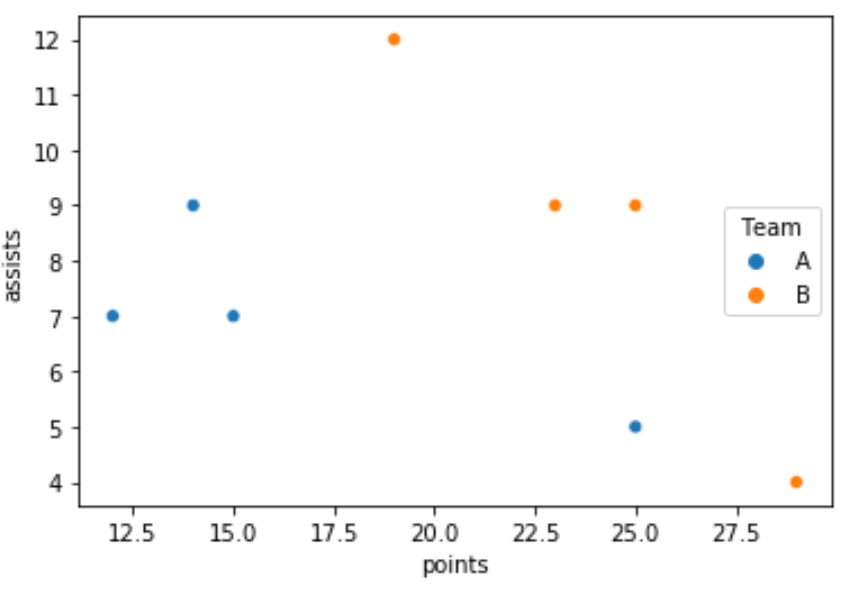
The following code shows how to place the legend inside the center right portion of a seaborn scatterplot:
import pandas as pd
import seaborn as sns
import matplotlib.pyplot as plt

#create fake data
df = pd.DataFrame({'points': [25, 12, 15, 14, 19, 23, 25, 29],
                   'assists': [5, 7, 7, 9, 12, 9, 9, 4],
                   'team': ['A', 'A', 'A', 'A', 'B', 'B', 'B', 'B']})

#create scatterplot
sns.scatterplot(data=df, x='points', y='assists', hue='team')

#place legend in center right of plot
plt.legend(loc='center right', title='Team')
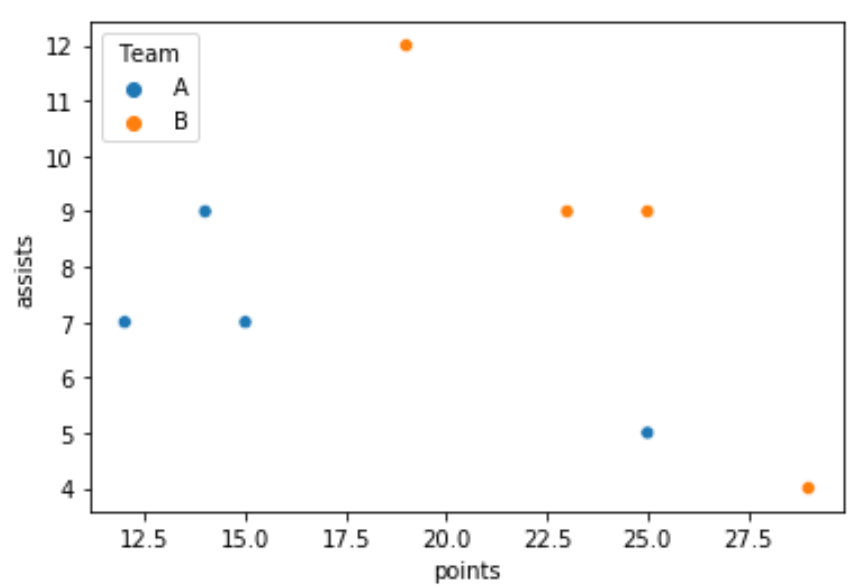
And the following code shows how to place the legend inside the upper left portion of a seaborn scatterplot:
#create scatterplot
sns.scatterplot(data=df, x='points', y='assists', hue='team')

#place legend in upper left of plot
plt.legend(loc='upper left', title='Team')
Example 2: Change Legend Position Outside of Seaborn Plot
To place the legend outside of a seaborn plot, we can use the bbox_to_anchor() argument.
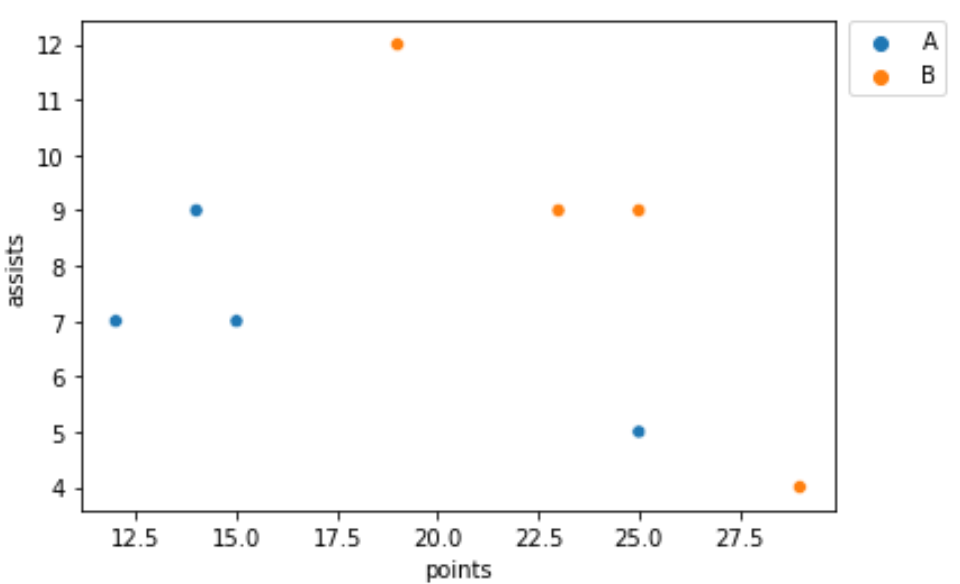
For example, here’s how to place the legend outside the top right corner of the plot:
import pandas as pd
import seaborn as sns
import matplotlib.pyplot as plt

#create fake data
df = pd.DataFrame({'points': [25, 12, 15, 14, 19, 23, 25, 29],
                   'assists': [5, 7, 7, 9, 12, 9, 9, 4],
                   'team': ['A', 'A', 'A', 'A', 'B', 'B', 'B', 'B']})

#create scatterplot
sns.scatterplot(data=df, x='points', y='assists', hue='team')

#place legend outside top right corner of plot
plt.legend(bbox_to_anchor=(1.02, 1), loc='upper left', borderaxespad=0)
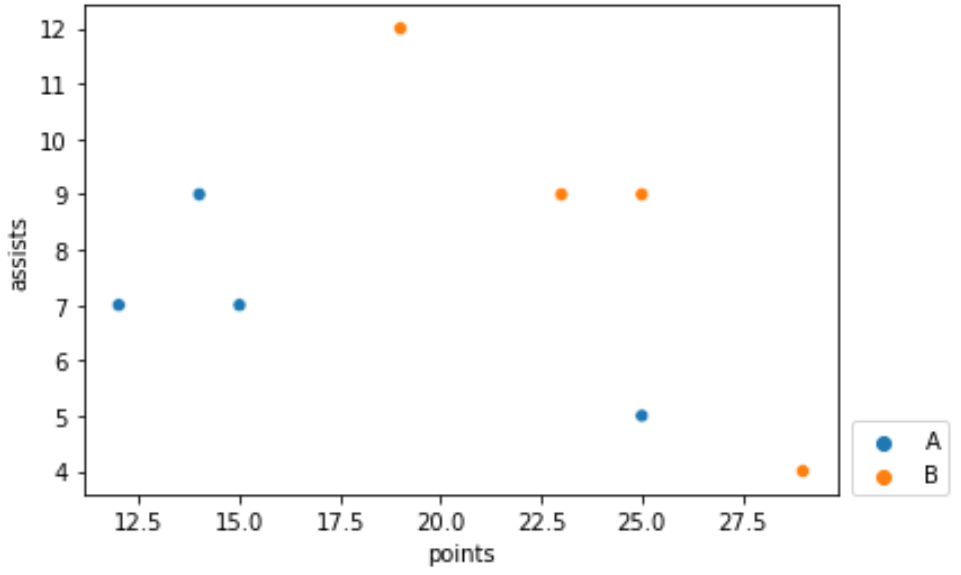
And here’s how to place the legend outside the bottom right corner of the plot:
#create scatterplot
sns.scatterplot(data=df, x='points', y='assists', hue='team')

#place legend outside bottom right corner of plot
plt.legend(bbox_to_anchor=(1.02, 0.15), loc='upper left', borderaxespad=0)
Refer to the matplotlib documentation for a detailed explanation of the bbox_to_anchor() argument.
Additional Resources
How to Adjust the Figure Size of a Seaborn Plot
How to Change Axis Labels on a Seaborn Plot
How to Change Legend Font Size in a Seaborn Plot