You can use the bbox_to_anchor() argument to place a seaborn legend outside of the plot.
For example, you can use the following syntax to place the legend in the top right corner outside of the plot:
plt.legend(bbox_to_anchor=(1.05, 1), loc='upper left', borderaxespad=0)
Note that the (1.05, 1) coordinates correspond to the (x, y) coordinates where the legend should be placed and the borderaxespad specifies the padding between the axes and the border legend.
The following examples show how to use this function in practice.
Example: Place Legend Outside of Seaborn Plot
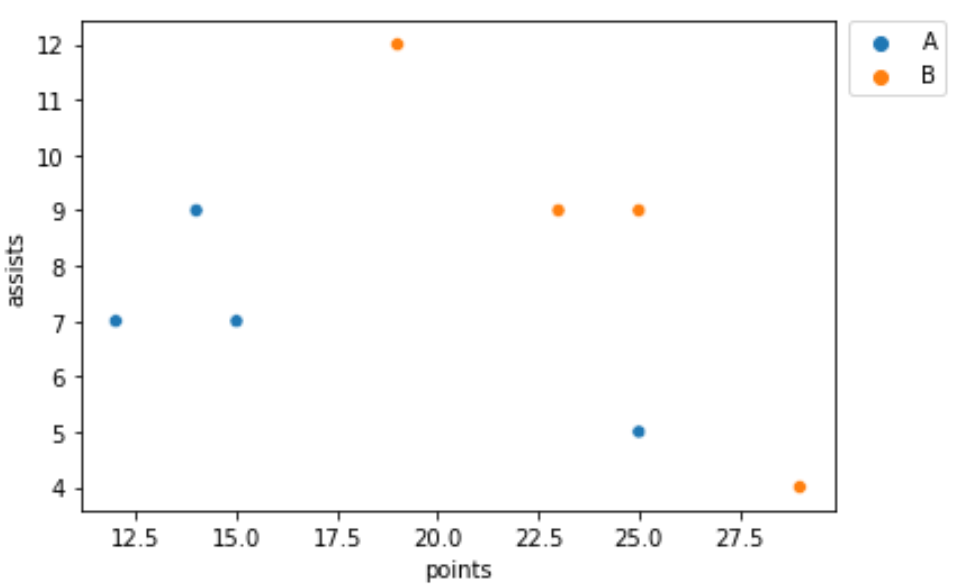
The following code shows how to place the legend outside the top right corner of a seaborn plot:
import pandas as pd
import seaborn as sns
import matplotlib.pyplot as plt

#create fake data
df = pd.DataFrame({'points': [25, 12, 15, 14, 19, 23, 25, 29],
                   'assists': [5, 7, 7, 9, 12, 9, 9, 4],
                   'team': ['A', 'A', 'A', 'A', 'B', 'B', 'B', 'B']})

#create scatterplot
sns.scatterplot(data=df, x='points', y='assists', hue='team')

#place legend outside top right corner of plot
plt.legend(bbox_to_anchor=(1.02, 1), loc='upper left', borderaxespad=0)
And here’s how to place the legend outside the center right border of the plot:
#create scatterplot
sns.scatterplot(data=df, x='points', y='assists', hue='team')

#place legend outside center right border of plot
plt.legend(bbox_to_anchor=(1.02, 0.55), loc='upper left', borderaxespad=0)

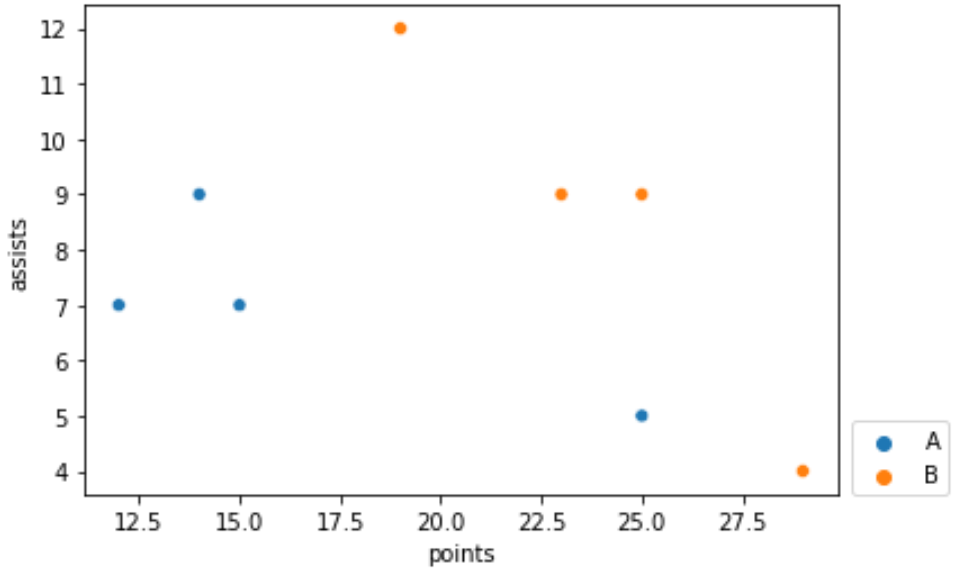
And here’s how to place the legend outside the bottom right corner of the plot:
#create scatterplot
sns.scatterplot(data=df, x='points', y='assists', hue='team')

#place legend outside bottom right corner of plot
plt.legend(bbox_to_anchor=(1.02, 0.15), loc='upper left', borderaxespad=0)
Refer to the matplotlib documentation for a detailed explanation of the bbox_to_anchor() argument.
Refer to the seaborn documentation for details on how to style the aesthetics of the plot.
Additional Resources
How to Adjust the Figure Size of a Seaborn Plot
How to Change Axis Labels on a Seaborn Plot
How to Change Legend Font Size in a Seaborn Plot