A heatmap is a type of chart that uses different shades of colors to represent data values.
This tutorial explains how to create heatmaps using the Python visualization library Seaborn with the following dataset:
#import seaborn
import seaborn as sns

#load "flights" dataset
data = sns.load_dataset("flights")
data = data.pivot("month", "year", "passengers")

#view first five rows of dataset
data.head()
Create a Basic Heatmap
We can use the following syntax to create a basic heatmap for this dataset:
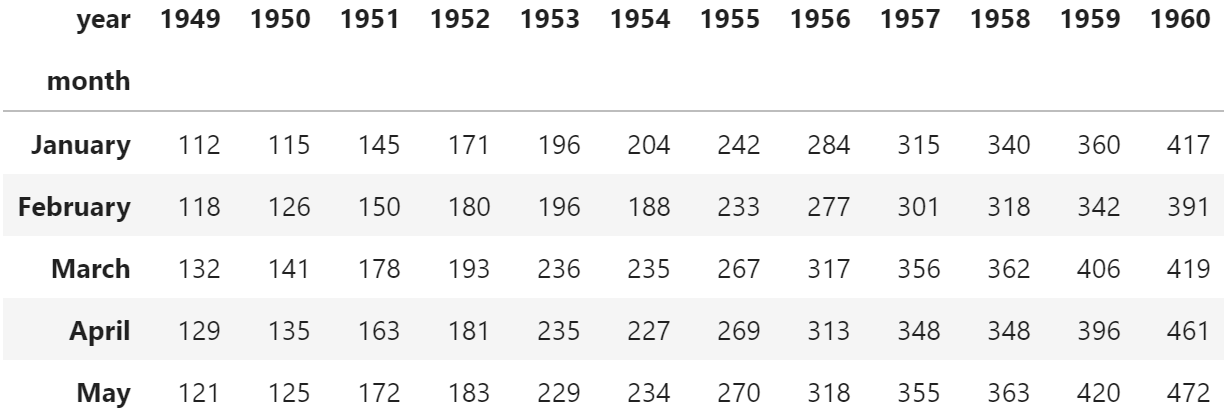
sns.heatmap(data)
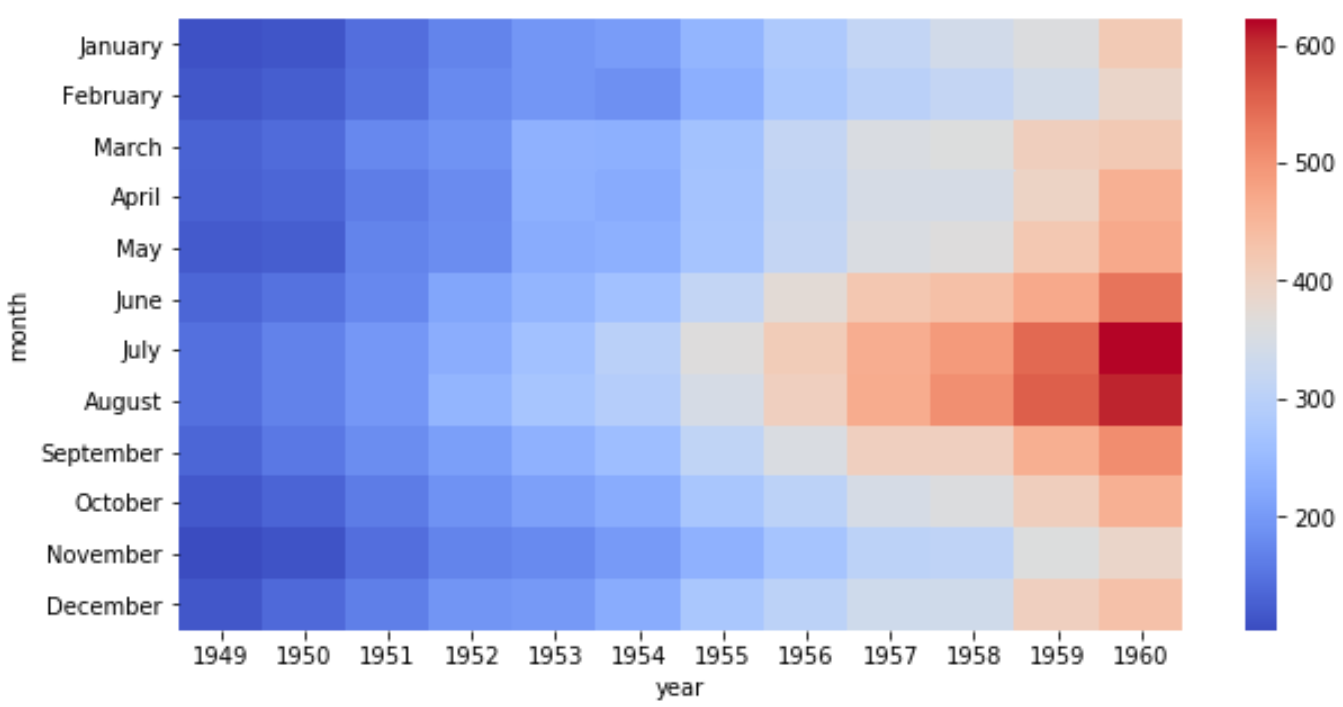
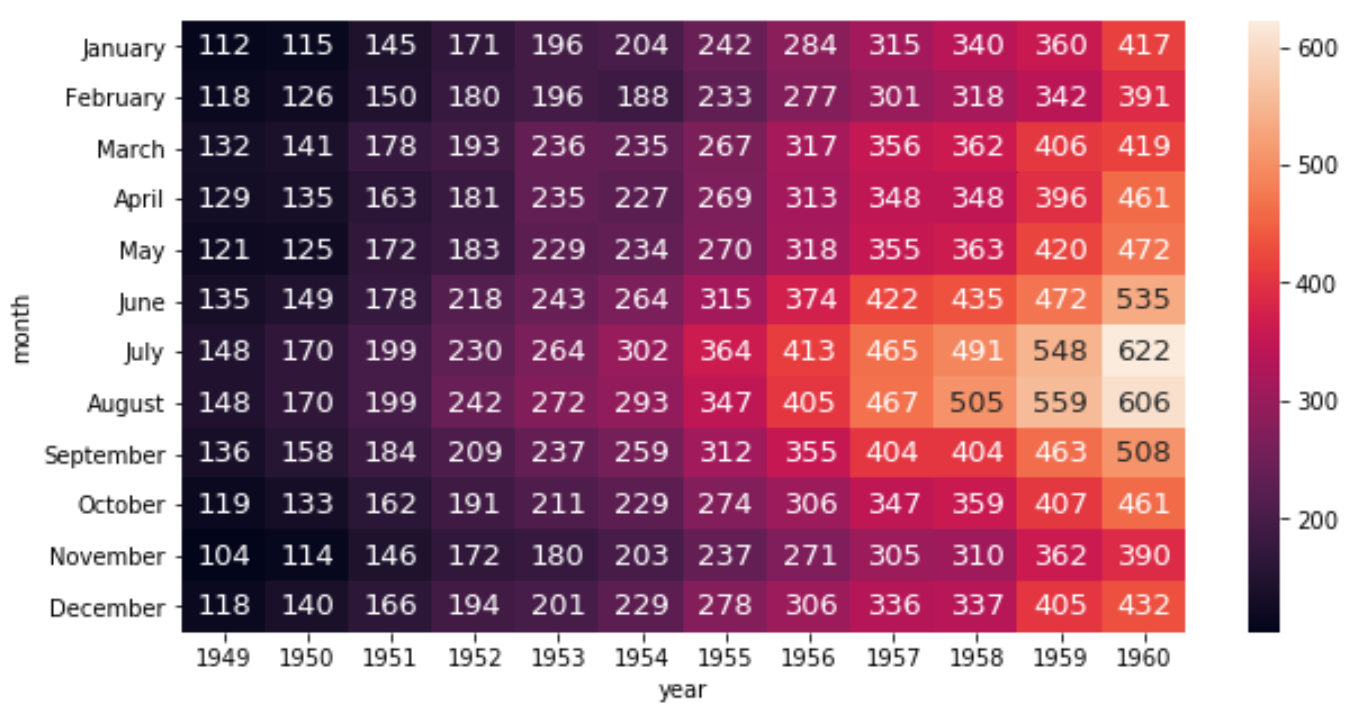
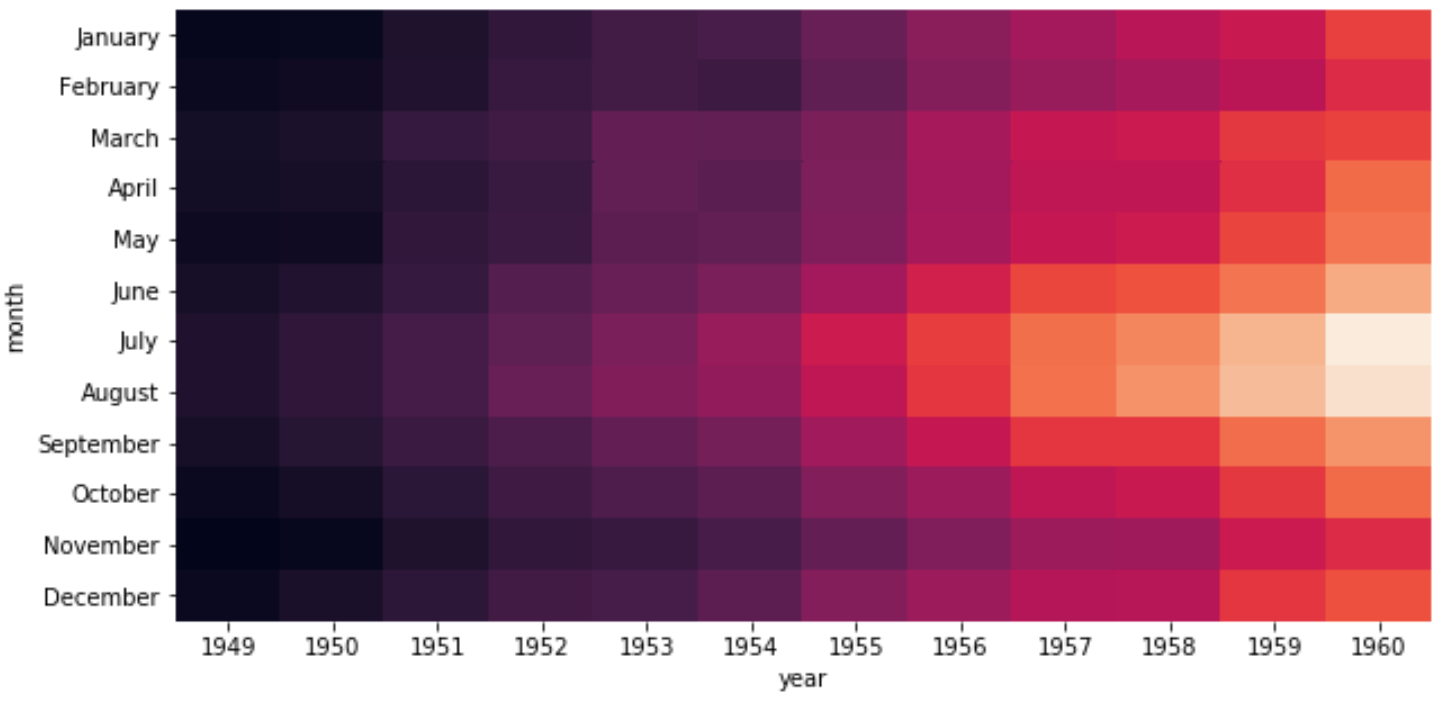
The x-axis displays the year, the y-axis displays the month, and the color of the squares within the heatmap represent the number of flights in those particular year-month combinations.
Adjust the Size of the Heatmap
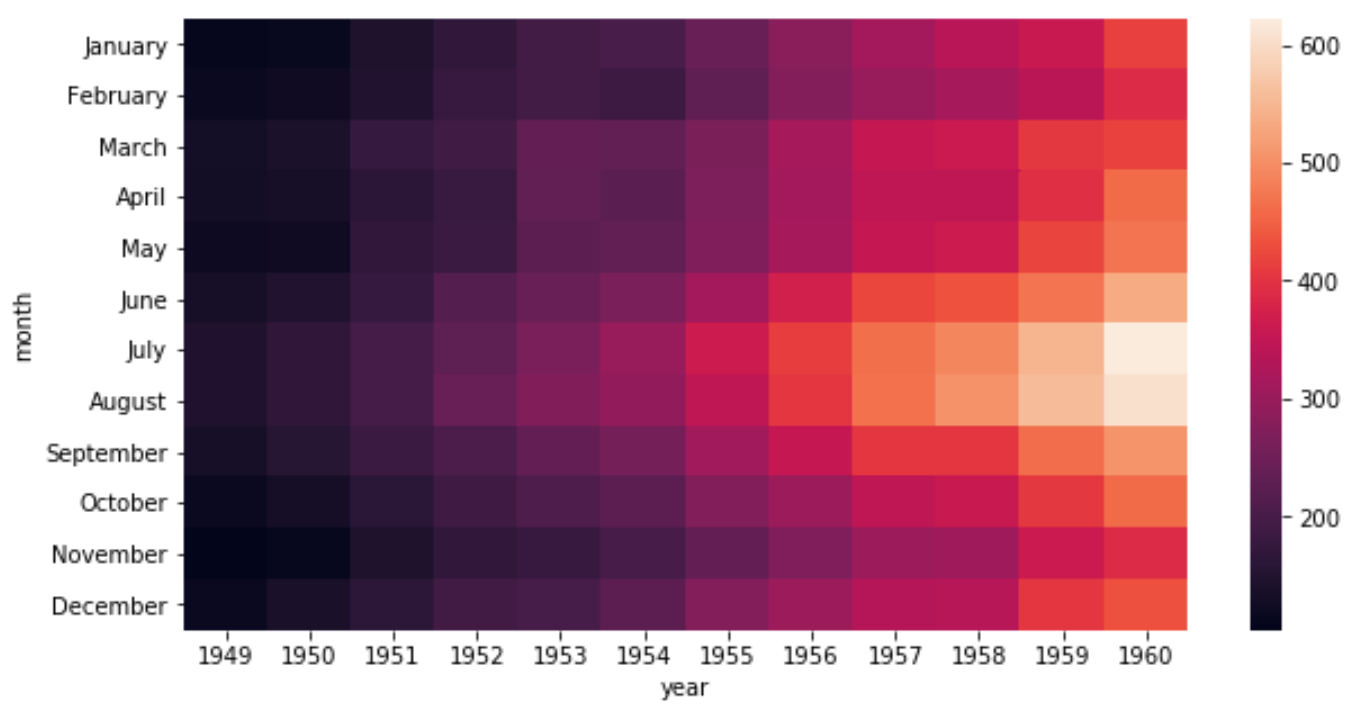
We can use the figsize argument to adjust the overall size of the heatmap:
#set heatmap size
import matplotlib.pyplot as plt
plt.figure(figsize = (12,8))

#create heatmap
sns.heatmap(data)
Change the Colors of the Heatmap
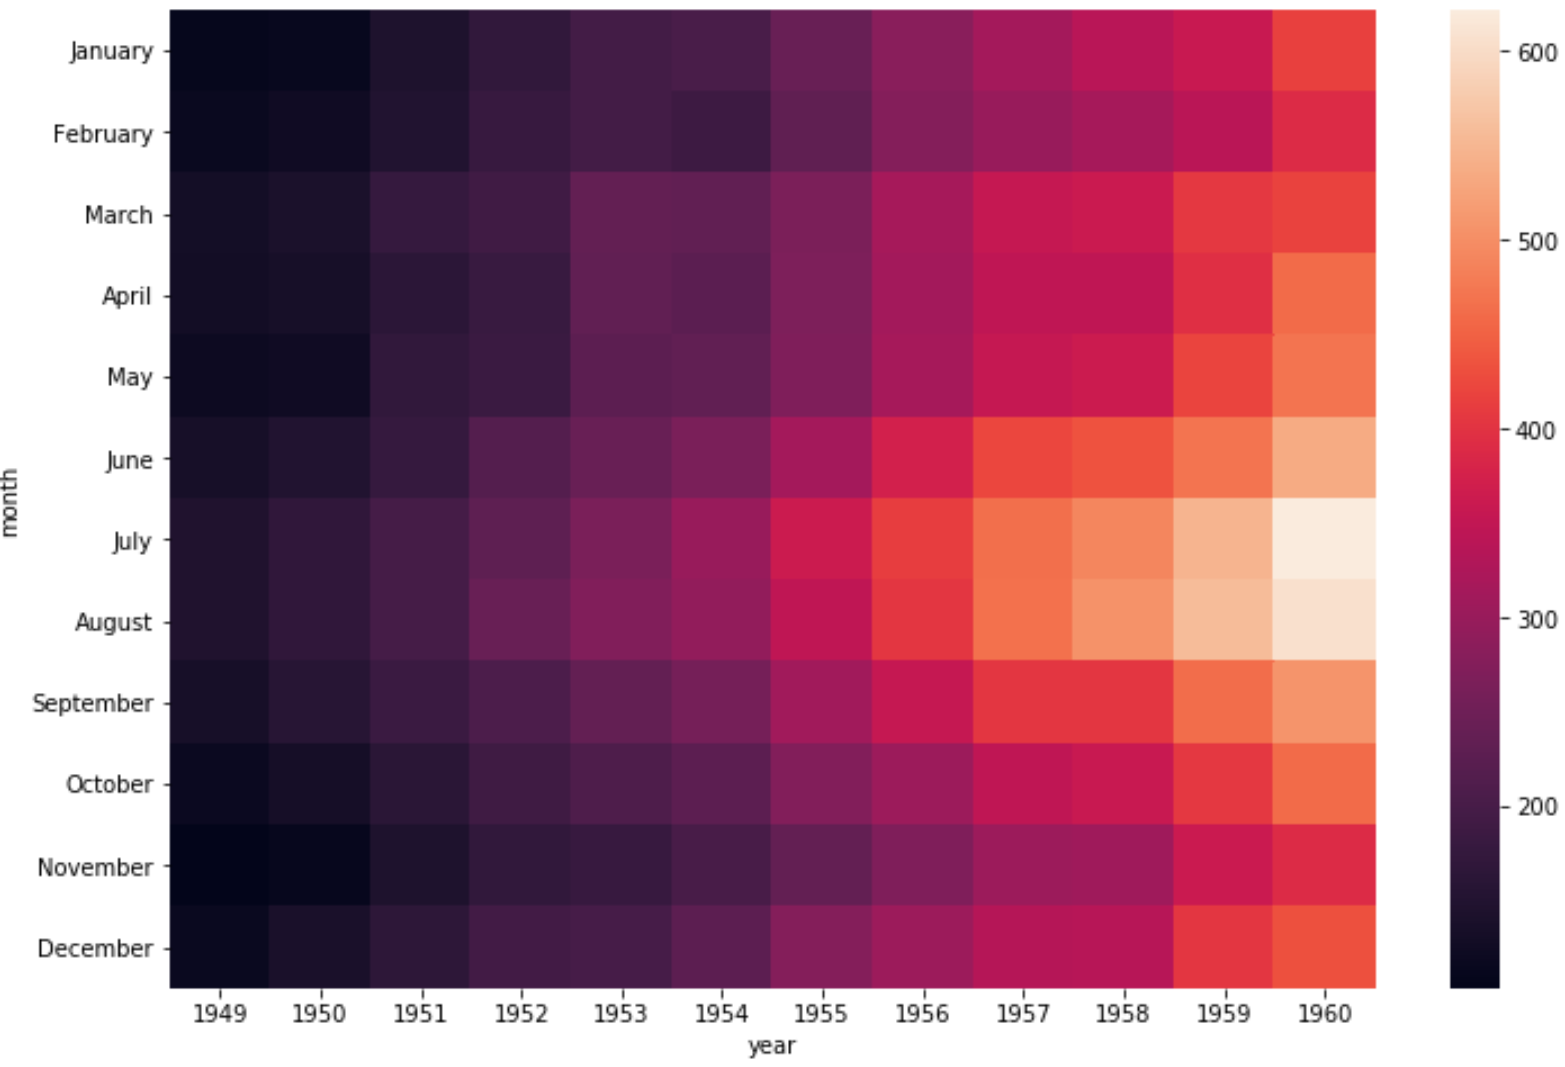
We can use the cmap argument to change the colors used in the heatmap. For example, we could choose the “Spectral” color map:
sns.heatmap(data, cmap="Spectral")
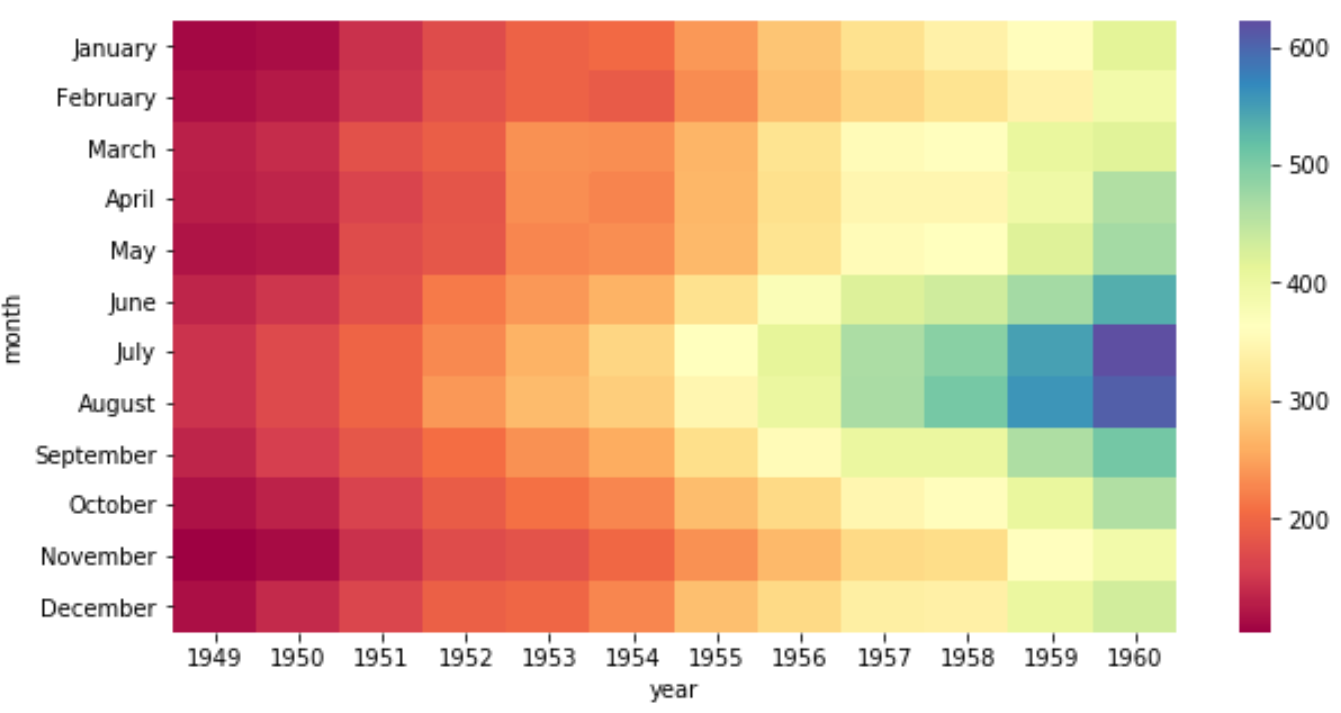
Or we could choose the “coolwarm” color map:
sns.heatmap(data, cmap="coolwarm")
Find a complete list of cmap options available here.
Annotate the Heatmap
We can use the following syntax to annotate each cell in the heatmap with integer formatting and specify the font size:
sns.heatmap(data, annot=True, fmt="d", annot_kws={"size":13})
Modify the Colorbar of the Heatmap
Lastly, we can turn the colorbar off if we’d like using the cbar argument:
sns.heatmap(data, cbar=False)
Find more Seaborn tutorials on this page.