There are two ways to change the figure size of a seaborn plot in Python.
The first method can be used to change the size of “axes-level” plots such as sns.scatterplot() or sns.boxplot() plots:
sns.set(rc={"figure.figsize":(3, 4)}) #width=3, #height=4
The second method can be used to change the size of “figure-level” plots such as sns.lmplot() and sns.catplot() or sns.jointplot() plots.
This method requires you to specify the height and aspect (the ratio of the width to the height) within the chart arguments:
sns.lmplot(data=df, x="var1", y="var2",
              height=6, aspect=1.5) #height=6, width=1.5 times larger than height
The following examples show how to use both of these methods in practice.
Method 1: Change the Size of Axes-Level Plots
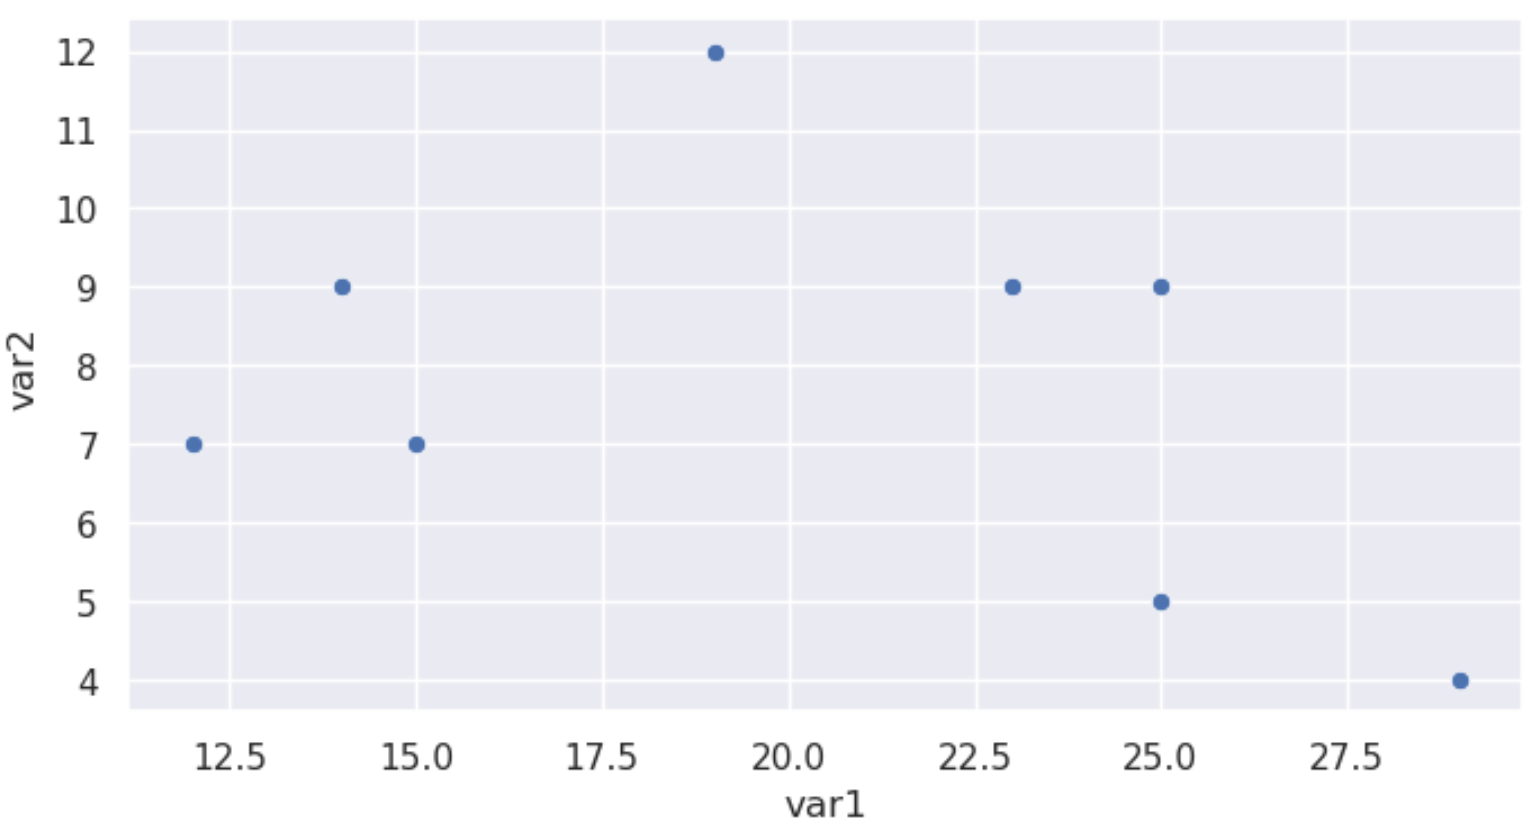
The following code shows how to create a seaborn scatterplot with a width of 8 and a height of 4:
import pandas as pd
import seaborn as sns

#create data
df = pd.DataFrame({"var1": [25, 12, 15, 14, 19, 23, 25, 29],
                   "var2": [5, 7, 7, 9, 12, 9, 9, 4],
                   "var3": [11, 8, 10, 6, 6, 5, 9, 12]})

#define figure size
sns.set(rc={"figure.figsize":(8, 4)}) #width=8, height=4

#display scatterplot
sns.scatterplot(data=df, x="var1", y="var2")
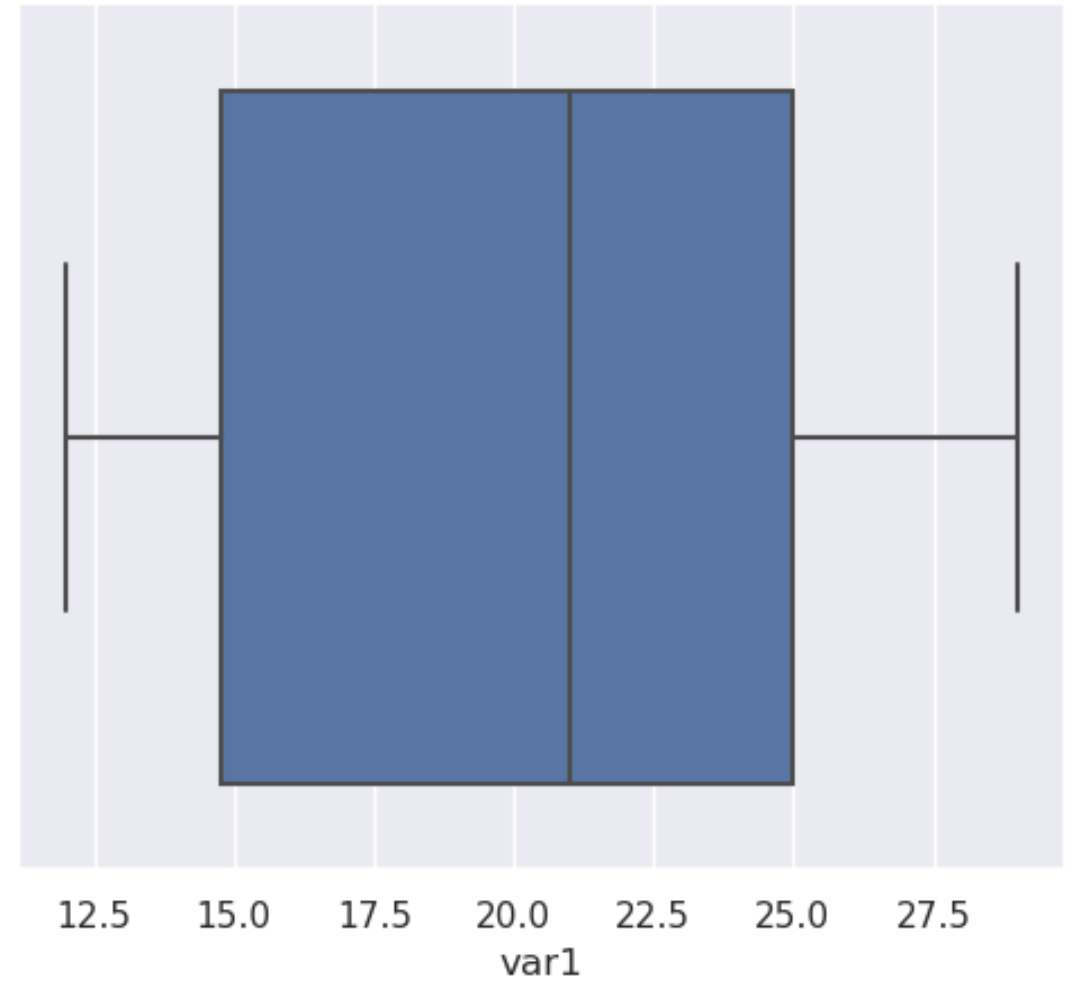
And the following code shows how to create a seaborn boxplot with a width of 6 and a height of 5:
#define figure size
sns.set(rc={"figure.figsize":(6, 5)}) #width=6, height=5

#display scatterplot
sns.boxplot(data=df["var1"])
Method 2: Change the Size of Figure-Level Plots
For figure-level plots (such as sns.lmplot, sns.catplot, sns.jointplot, etc.), you must specify the height and width within the chart itself.
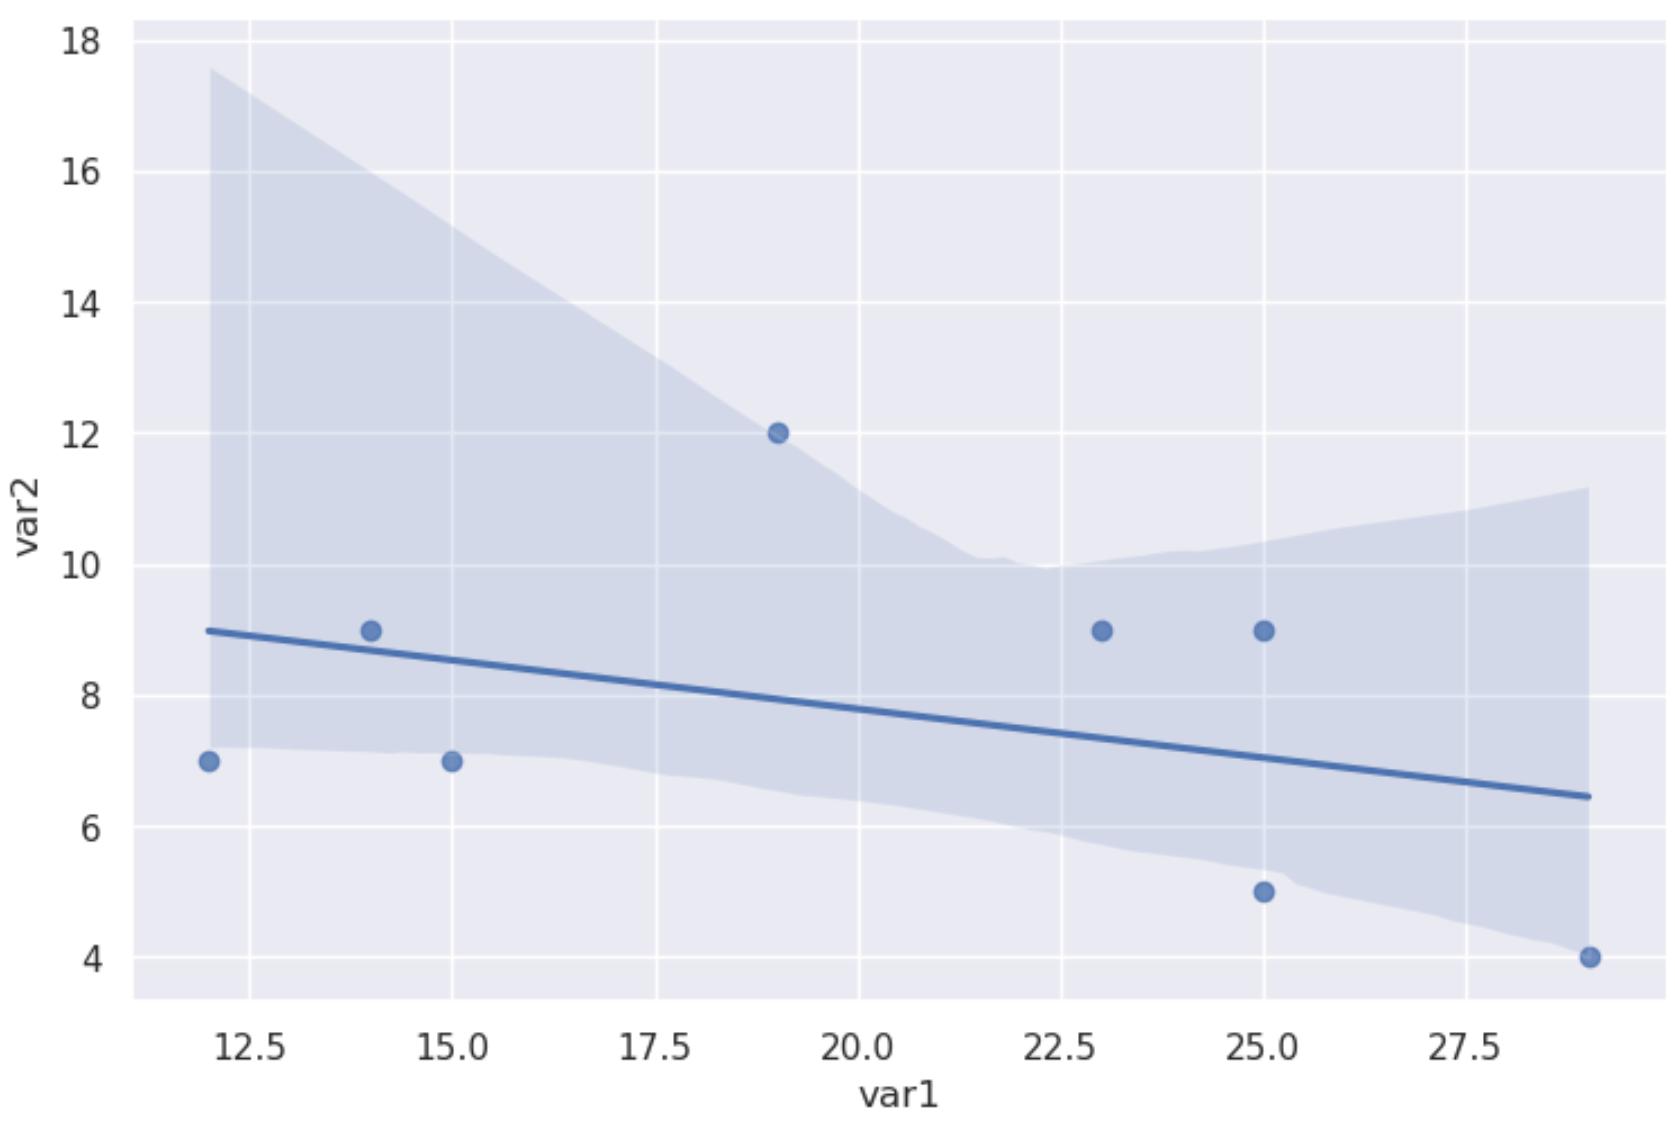
The following code shows how to create a seaborn lmplot with a height of 5 and a width 1.5 times larger than the height:
import pandas as pd
import seaborn as sns

#create data
df = pd.DataFrame({"var1": [25, 12, 15, 14, 19, 23, 25, 29],
                   "var2": [5, 7, 7, 9, 12, 9, 9, 4],
                   "var3": [11, 8, 10, 6, 6, 5, 9, 12]})

#create lmplot
sns.lmplot(data=df, x="var1", y="var2",
              height=5, aspect=1.5) #height=5, width=1.5 times larger than height
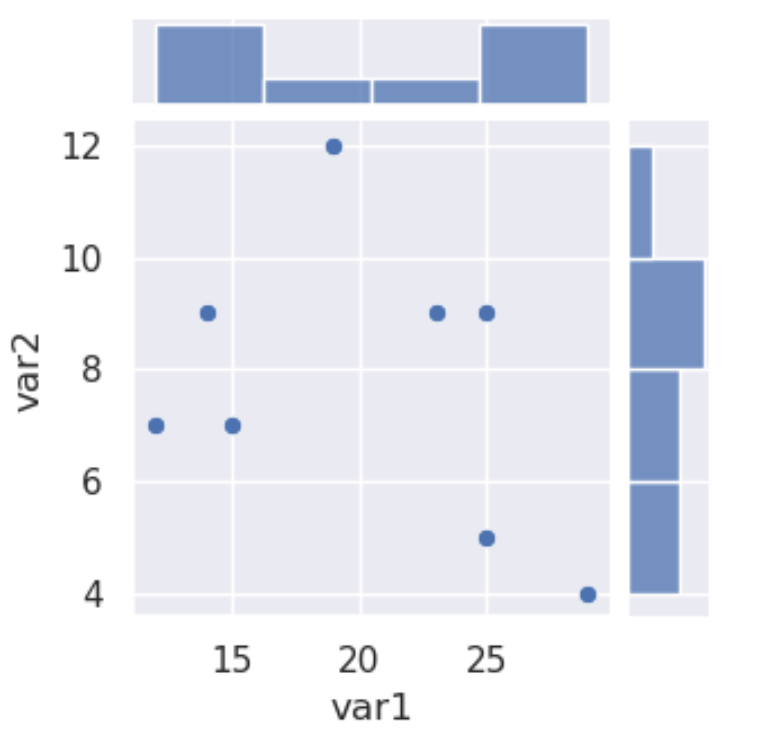
And the following code shows how to create a seaborn jointplot with a height of 3.5. Since a jointplot is square by default, we don’t need to specify the aspect value:
sns.jointplot(data=df, x="var1", y="var2", height=3.5)
Check out the seaborn documentation for an in-depth explanation of the difference between figure-level and axes-level functions.
Additional Resources
How to Add a Title to Seaborn Plots
How to Change Axis Labels on a Seaborn Plot
How to Change the Position of a Legend in Seaborn