You can use the following function to display the values on a seaborn barplot:
def show_values(axs, orient="v", space=.01):
    def _single(ax):
        if orient == "v":
            for p in ax.patches:
                _x = p.get_x() + p.get_width() / 2
                _y = p.get_y() + p.get_height() + (p.get_height()*0.01)
                value = '{:.1f}'.format(p.get_height())
                ax.text(_x, _y, value, ha="center")
        elif orient == "h":
            for p in ax.patches:
                _x = p.get_x() + p.get_width() + float(space)
                _y = p.get_y() + p.get_height() - (p.get_height()*0.5)
                value = '{:.1f}'.format(p.get_width())
                ax.text(_x, _y, value, ha="left")

    if isinstance(axs, np.ndarray):
        for idx, ax in np.ndenumerate(axs):
            _single(ax)
    else:
        _single(axs)
This function works for both horizontal and vertical barplots.
The following examples show how to use this function in practice with the built-in seaborn “tips” dataset:
import seaborn as sns
import pandas as pd
import numpy as np

#load tips dataset
data = sns.load_dataset("tips")

#view first five rows
data.head()

	total_bill	tip	sex	smoker	day	time	size
0	16.99	        1.01	Female	No	Sun	Dinner	2
1	10.34	        1.66	Male	No	Sun	Dinner	3
2	21.01	        3.50	Male	No	Sun	Dinner	3
3	23.68	        3.31	Male	No	Sun	Dinner	2
4	24.59	        3.61	Female	No	Sun	Dinner	4
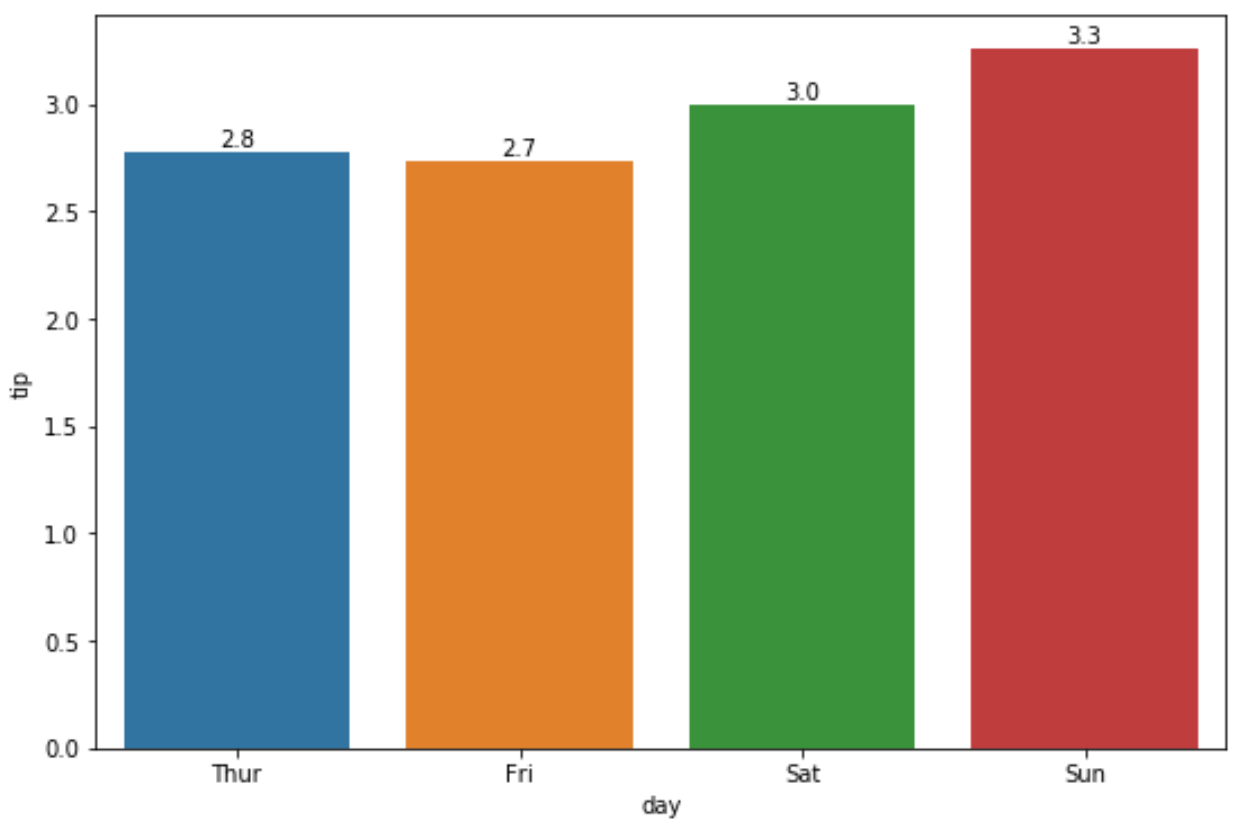
Example 1: Show Values on Vertical Barplot
The following code shows how to display the values on a vertical barplot:
#create vertical barplot
p = sns.barplot(x="day", y="tip", data=data, ci=None)

#show values on barplot
show_values(p)
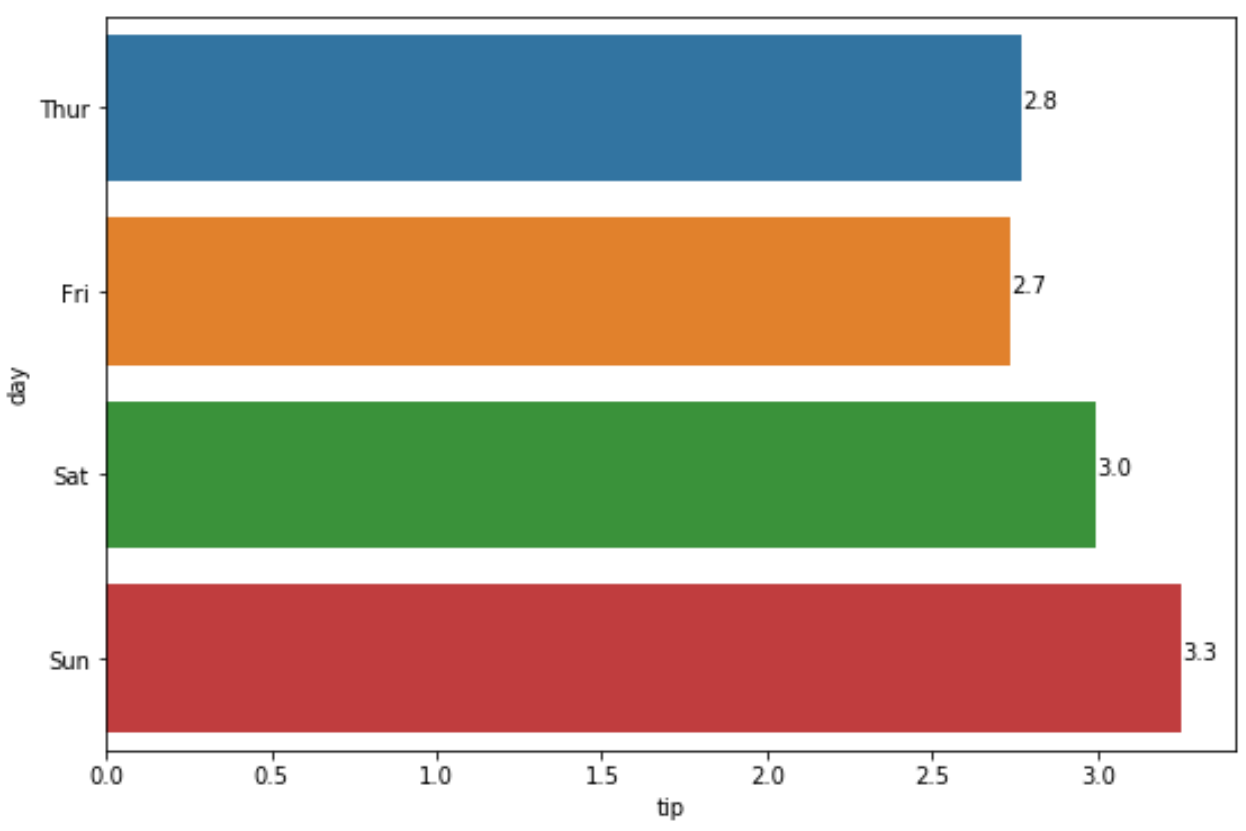
Example 2: Show Values on Horizontal Barplot
The following code shows how to display the values on a horizontal barplot:
#create horizontal barplot
p = sns.barplot(x="tip", y="day", data=data, ci=None)

#show values on barplot
show_values(p, "h", space=0)
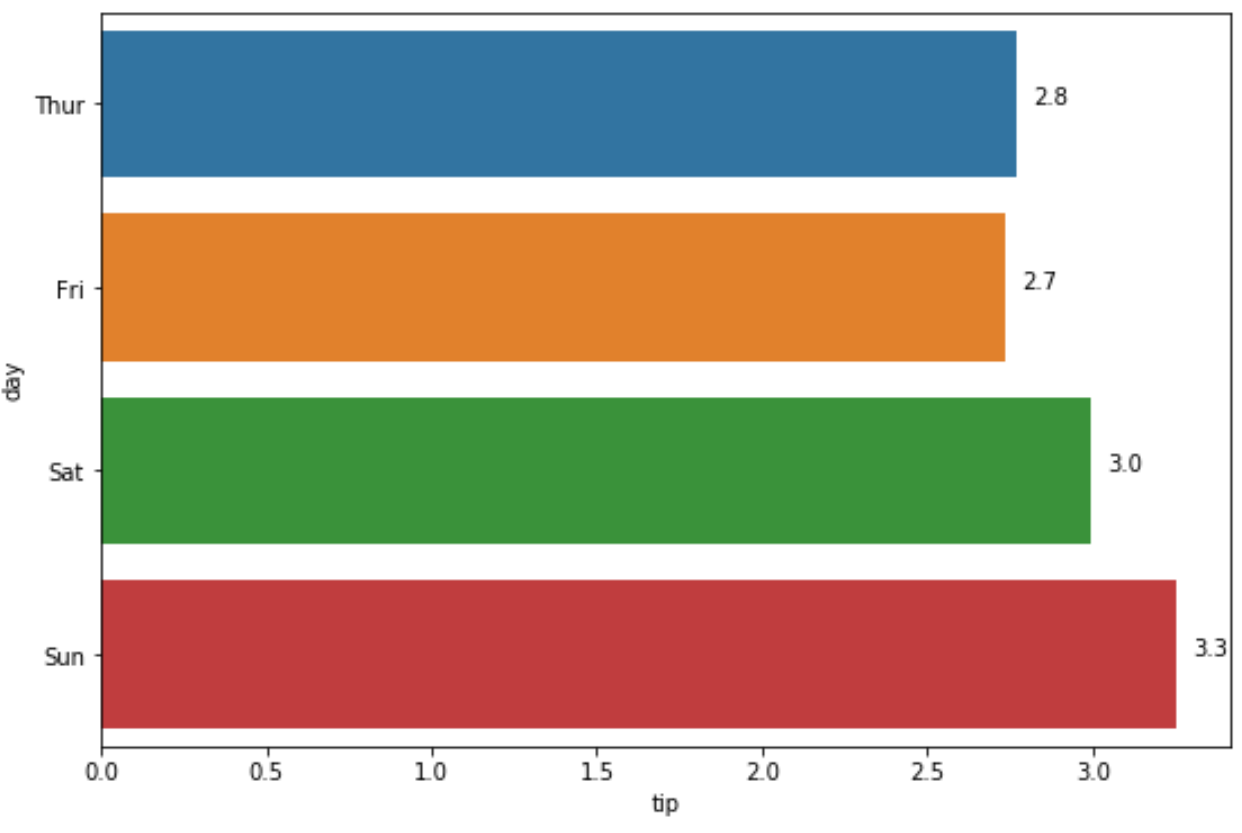
Note that the larger the value you use for space, the further away the labels will be from the bars.
For example, let’s change the space from 0 to .05:
#create horizontal barplot
p = sns.barplot(x="tip", y="day", data=data, ci=None)

#show values on barplot
show_values(p, "h", space=0.05)
Note: To change the number of decimal places shown, simply change the value in this line of the function:
value = '{:.1f}'.format(p.get_height())
For example, change it from .1f to .2f to show two decimal places instead of one.
Additional Resources
The following tutorials explain how to perform other common functions in seaborn:
How to Create a Pie Chart in Seaborn
How to Create a Time Series Plot in Seaborn
How to Create Multiple Seaborn Plots in One Figure