You can use proc freq in SAS to quickly create frequency tables for one or more variables in a dataset.
The following examples show how to use this procedure with the SAS built-in dataset called BirthWgt, which contains various characteristics for 100,000 mothers that recently gave birth.
We can use proc print to view the first 10 observations from this dataset:
/*view first 10 observations from BirthWgt dataset*/
proc print data=sashelp.BirthWgt (obs=10);

run;
Example 1: Frequency Table for One Variable
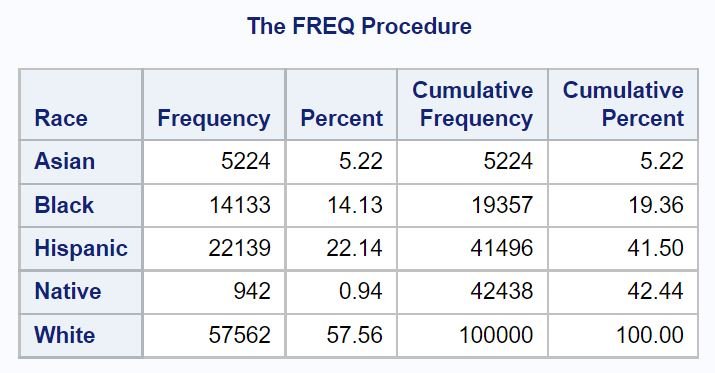
We can use the following code to create a frequency table for the Race variable:
/*create frequency table for Race variable*/
proc freq data=sashelp.BirthWgt;
	tables Race;
run;
The output table contains four columns:
- Frequency: The total number of observations that fell in a certain category.
- Percent: The percentage of total observations that fell in a certain category.
- Cumulative Frequency: The total number of observations that have been accounted for up to and including the current row.
- Cumulative Percent: The cumulative percentage of total observations that have been accounted for up to and including the current row.
For example, from the output table we can see:
- The total number of Hispanic mothers was 22,139.
- The percentage of total mothers who were Hispanic was 22.14%.
- The total number of mothers who were Asian, Black, or Hispanic was 41,496.
- The cumulative percentage of mothers who were Asian, Black, or Hispanic was 41.50%.
Example 2: Frequency Table for One Variable (Sorted)
By default, frequency tables are sorted in alphabetical order based on the category names. However, we can use the order function to sort the categories by frequency instead:
/*create frequency table for Race variable, sorted by frequency*/
proc freq data=sashelp.BirthWgt order=freq;
	tables Race;
run;
Notice that the categories are now sorted based on frequency from highest to lowest.
Example 3: Frequency Table for One Variable (Include Missing Values)
By default, missing values are not included in frequency tables.
However, we can use the missing command to tell SAS to include a row to count the frequency of missing values:
/*create frequency table for Race variable, sorted by frequency*/
proc freq data=sashelp.BirthWgt order=freq;
	tables Race / missing;
run;
Since no additional row was added to the frequency table, this tells us that there were no missing values for Race in the original dataset.
Example 4: Frequency Table for Multiple Variables
To create a frequency table for multiple variables at once, we can simply include multiple variable names in the tables argument.
For example, we can use the following code to create a frequency table for both Race and AgeGroup:
/*create frequency table for Race and AgeGroup variables, both sorted by frequency*/
proc freq data=sashelp.BirthWgt order=freq;
	tables Race AgeGroup;
run;
We can see that a frequency table was created for both variables.


