Often in statistics we’re interested in answering questions like:
- What is the mean household income in a certain city?
- What is the mean weight of a certain species of turtle?
- What is the mean attendance at college football games?
In each scenario, we are interested in answering some question about a population, which represents every possible individual element that we’re interested in measuring.
However, instead of collecting data on every individual in a population we instead collect data on a sample of the population, which represents a portion of the total population.
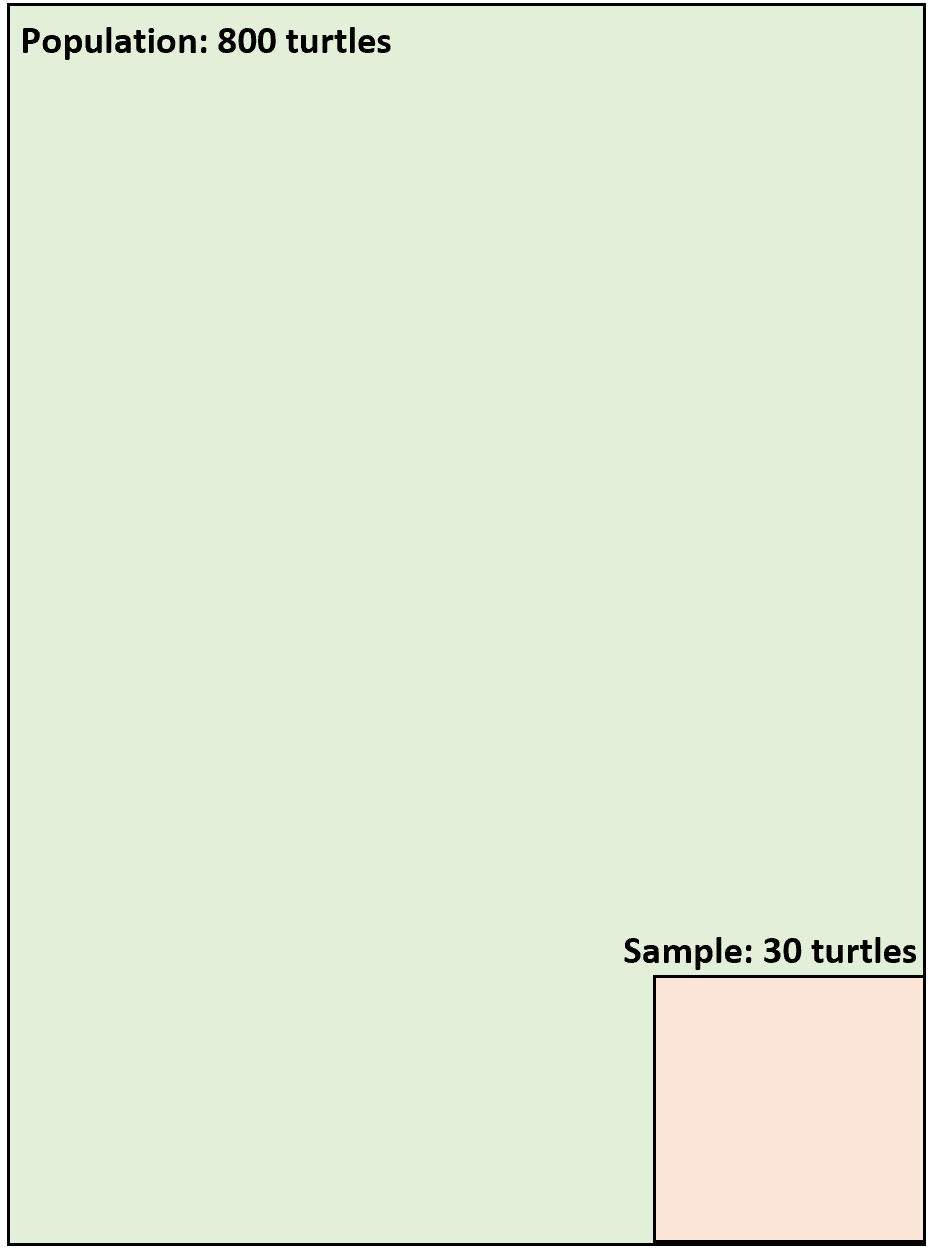
For example, we might want to know the mean weight of a certain species of turtle that has a total population of 800 turtles.
Since it would take too long to locate and weigh every single turtle in the population, we instead collect a simple random sample of 30 turtles and measure their weights:
We could then use the mean weight of this sample of turtles to estimate the mean weight of all turtles in the population.
How to Calculate the Sample Mean
The formula to calculate the sample mean, often denoted x, is as follows:
x = Σxi / n
where:
- Σ: A fancy Greek symbol that means “sum”
- xi: The value of the ith observation in the dataset
- n: The sample size
For example, suppose we collect a sample of 10 turtles with the following weights (in pounds):
- 70, 80, 80, 85, 90, 95, 110, 120, 140, 150
The sample mean would be calculated as:
- x = (70+ 80+80+85+90+95+110+120+140+150) / 10 = 102
Why the Sample Mean is Unbiased
In statistical jargon, we would say that the sample mean is a statistic while the population mean is a parameter.
Here’s the difference between the two terms:
A statistic is a number that describes some characteristic of a sample.
A parameter is a number that describes some characteristic of a population.
The parameter is the value that we’re actually interested in measuring, but the statistic is the value that we use to estimate the value of the parameter since the statistic is so much easier to obtain.
When we use a method like simple random sampling to obtain a sample, we say that the sample mean is an unbiased estimator of the population mean.
In other words, we have no reason to believe that the sample mean would underestimate or overestimate the true population mean.
The reason is because when we use a method like simple random sampling, every member in the population has an equal chance of being included in the sample, which means the sample is likely to be a “mini version” of the overall population.
We would say that the sample is representative of the overall population, which means that the sample mean should be a good estimate of the population mean, assuming that the sample size is large enough.
On Using Confidence Intervals with the Sample Mean
Although the sample mean provides an unbiased estimate of the population mean, it’s unlikely that the sample mean will exactly match the population mean.
For example, if we want to use a sample of turtles to estimate the mean weight of a population of turtles, it’s possible that we might just happen to pick a sample full of low-weight turtles or perhaps a sample full of heavy turtles.
In order to capture this uncertainty around our estimate of the population mean, we can create a confidence interval.
A confidence interval is a range of values that is likely to contain a population parameter with a certain level of confidence.
For example, we might collect a sample of 30 turtles and find that the mean weight of this sample is 102 pounds. If we then construct a 95% confidence interval, we might find that the interval is as follows:
95% confidence interval = [98.5, 105.5]
We would interpret this to mean there is a 95% chance that the confidence interval of [98.5, 105.5] contains the true population mean weight of turtles.
This confidence interval is more useful than just the sample mean because it gives us a range of values that the true population mean is likely to fall in.
Additional Resources
Population vs. Sample: What’s the Difference?
Statistic vs. Parameter: What’s the Difference?
An Introduction to Confidence Intervals


