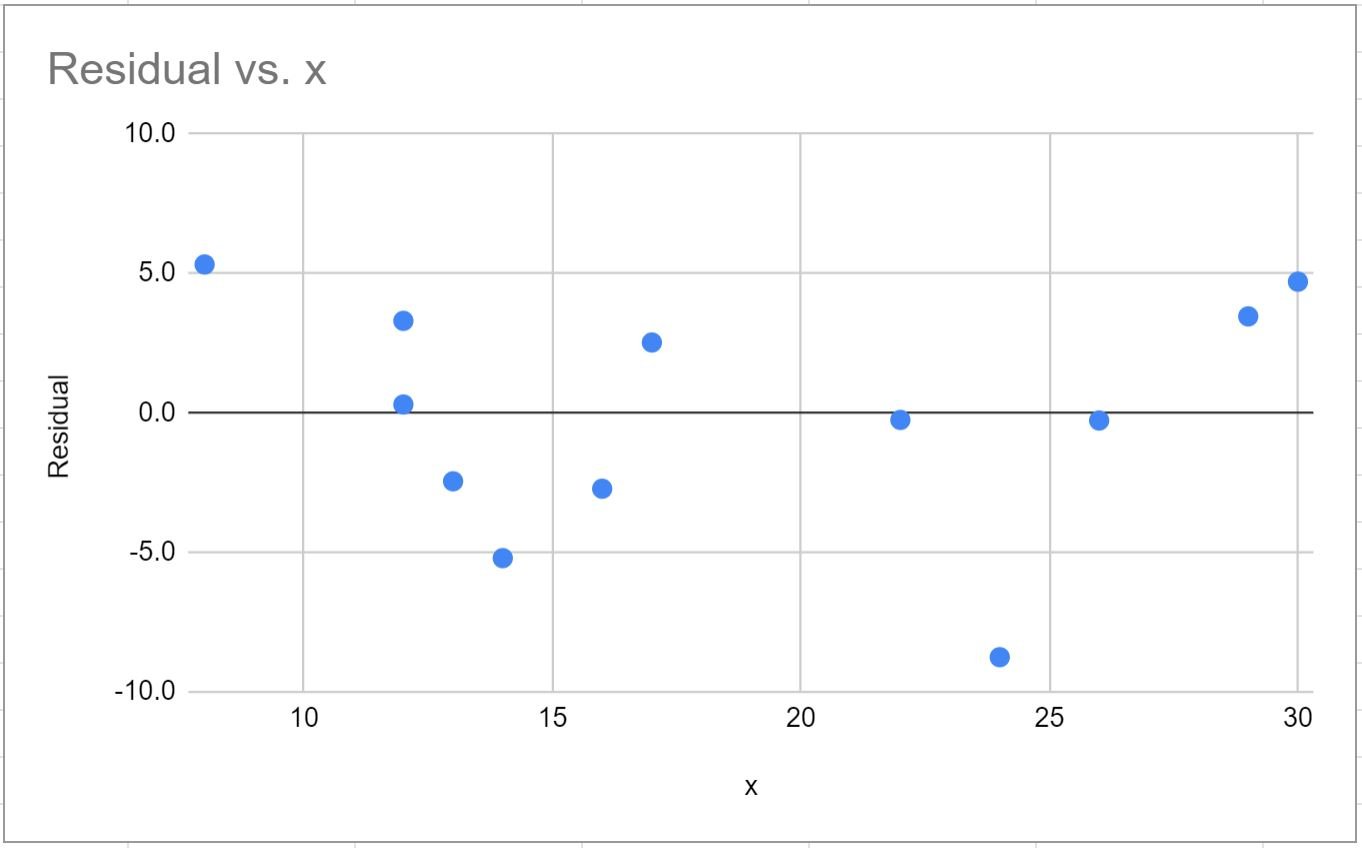
A residual plot is a type of plot that displays the fitted values against the residual values for a regression model.
This type of plot is often used to assess whether or not a linear regression model is appropriate for a given dataset and to check for heteroscedasticity of residuals.
The following step-by-step example explains how to create a residual plot for a simple linear regression model in Google Sheets.
Step 1: Enter the Data
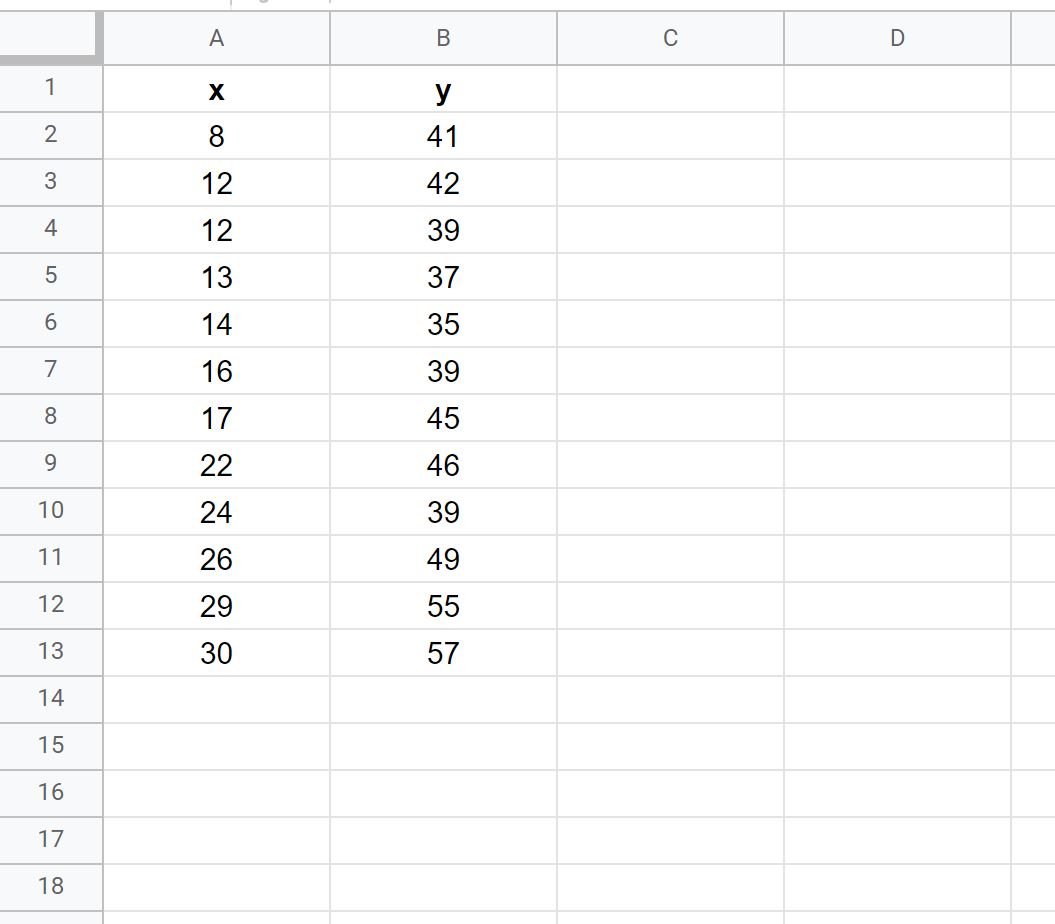
First, let’s enter the following values for a dataset:
Step 2: Calculate the Equation of the Regression Model
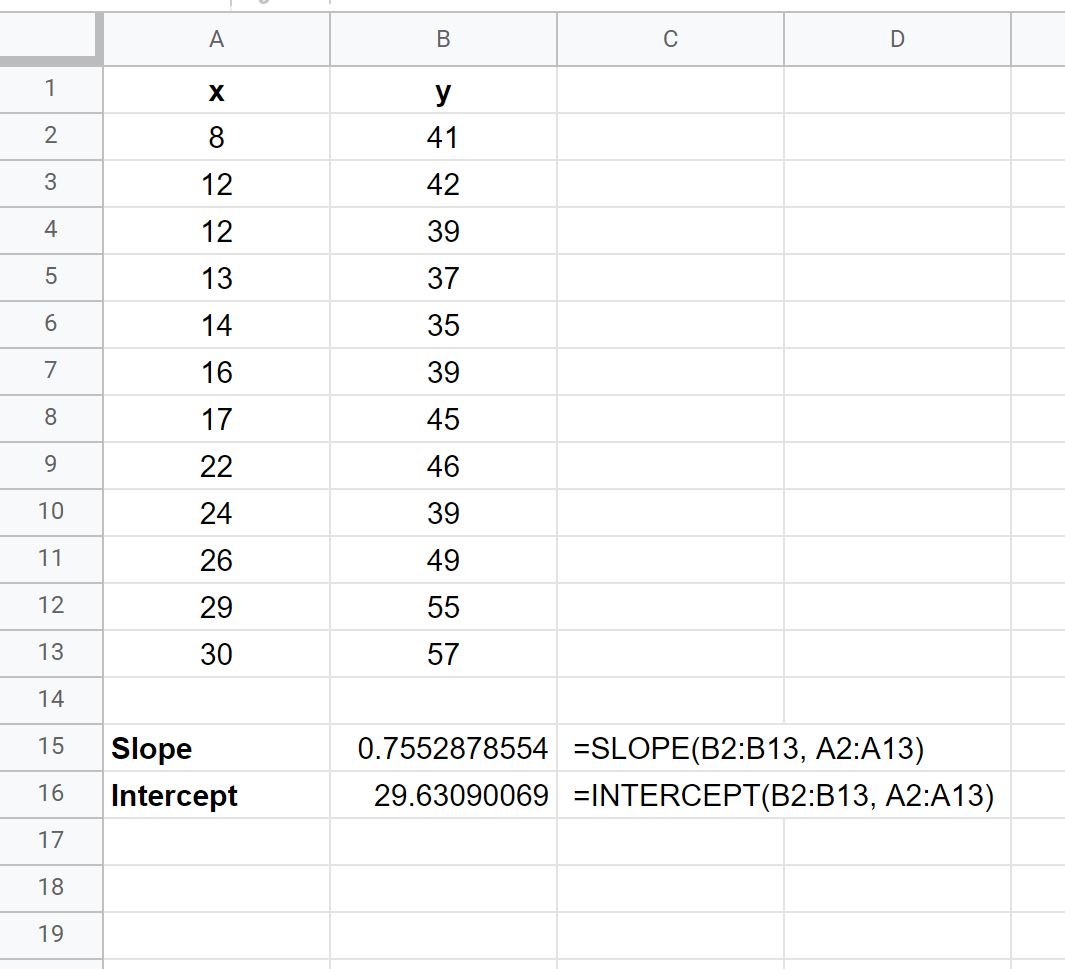
Next, we’ll use the SLOPE and INTERCEPT functions to calculate the equation of the simple linear regression model for this dataset:
Using these values, we can write the following simple linear regression equation:
y = 29.631 + 0.755x
Step 3: Calculate the Predicted Values
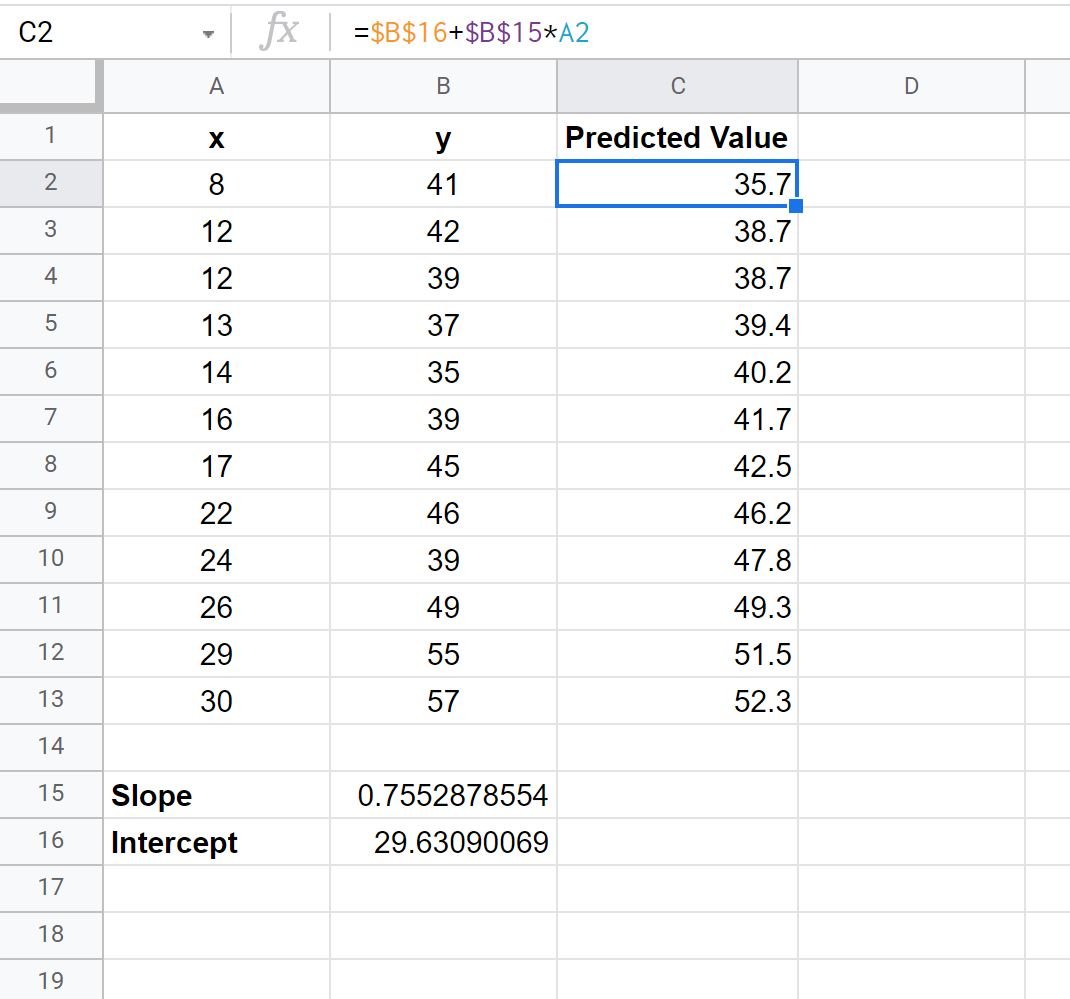
Next, we can use the regression equation to calculate the predicted values for each observation.
We’ll type the following formula into cell C2:
=$B$16+$B$15*A2
We can then copy and paste this formula down to every remaining cell in column C:
Step 4: Calculate the Residuals
A residual is the difference between an observed value and a predicted value in a regression model.
It is calculated as:
Residual = Observed value – Predicted value
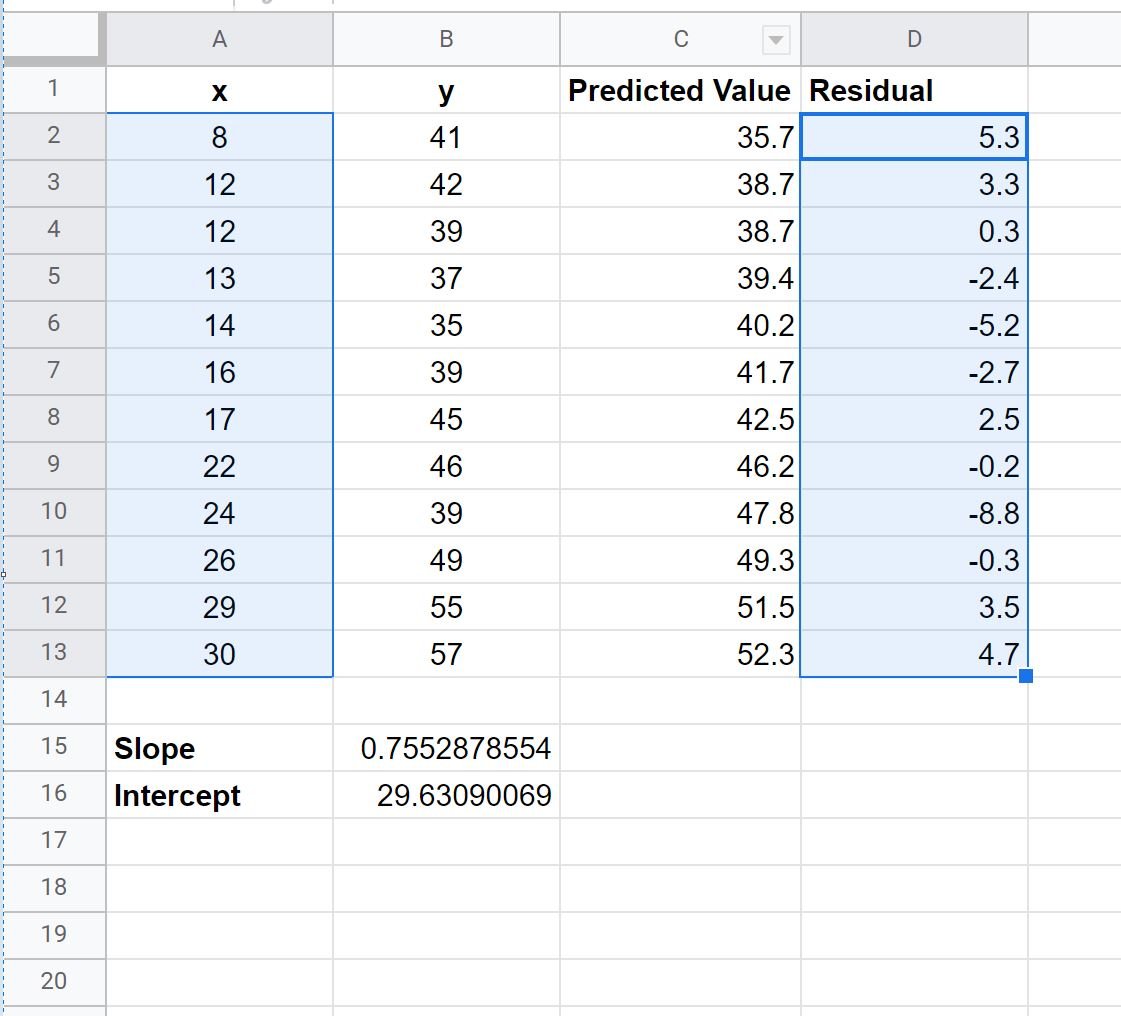
To calculate the residual for each observation in our dataset, we can type the following formula into cell D2:
=B2-C2
We can then copy and paste this formula down to every remaining cell in column D:
Step 5: Create the Residual Plot
To create the residual plot, we can highlight the values in the range A2:A13, then hold the “Ctrl” key and highlight the values in the range D2:D13.
Then click the Insert tab, then click Chart in the dropdown menu.
In the Chart editor panel that appears on the right side of the screen, choose Scatter chart as the Chart type:
The following residual plot will automatically appear:
The x-axis displays the values for the predictor variable in our regression model and the y-axis displays the residuals.
One key assumption of linear regression is that the residuals have constant variance at every level of x, so we often use a residual plot to determine if this assumption is met.
If the residuals are roughly evenly scattered around zero in the plot with no clear pattern, then we typically say the assumption of constant variance is met.
In our residual plot above we can see that the points in the plot seem to be randomly scattered around zero with no clear pattern, thus we would conclude that the constant variance assumption is met for this particular regression model.
Additional Resources
The following tutorials explain how to perform other common tasks in Google Sheets:
How to Perform Linear Regression in Google Sheets
How to Perform Polynomial Regression in Google Sheets


