A repeated measures ANOVA is used to determine whether or not there is a statistically significant difference between the means of three or more groups in which the same subjects show up in each group.
We use a one-way repeated measures ANOVA in two specific situations:
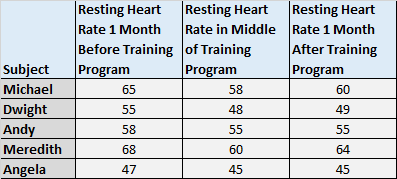
1. Measuring the mean scores of subjects during three or more time points. For example, you might want to measure the resting heart rate of subjects one month before they start a training program, during the middle of the training program, and one month after the training program to see if there is a significant difference in mean resting heart rate across these three time points.
Notice how the same subjects show up at each time point. We repeatedly measured the same subjects, hence the reason why we used a one-way repeated measures ANOVA.
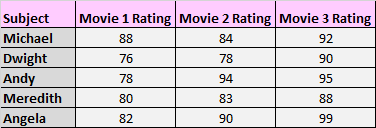
2. Measuring the mean scores of subjects under three different conditions. For example, you might have subjects watch three different movies and rate each one based on how much they enjoyed it.
Again, the same subjects show up in each group, so we need to use a one-way repeated measures ANOVA to test for the difference in means across these three conditions.
This tutorial explains how to conduct a one-way repeated measures ANOVA in Stata.
Example: Repeated Measures ANOVA in Stata
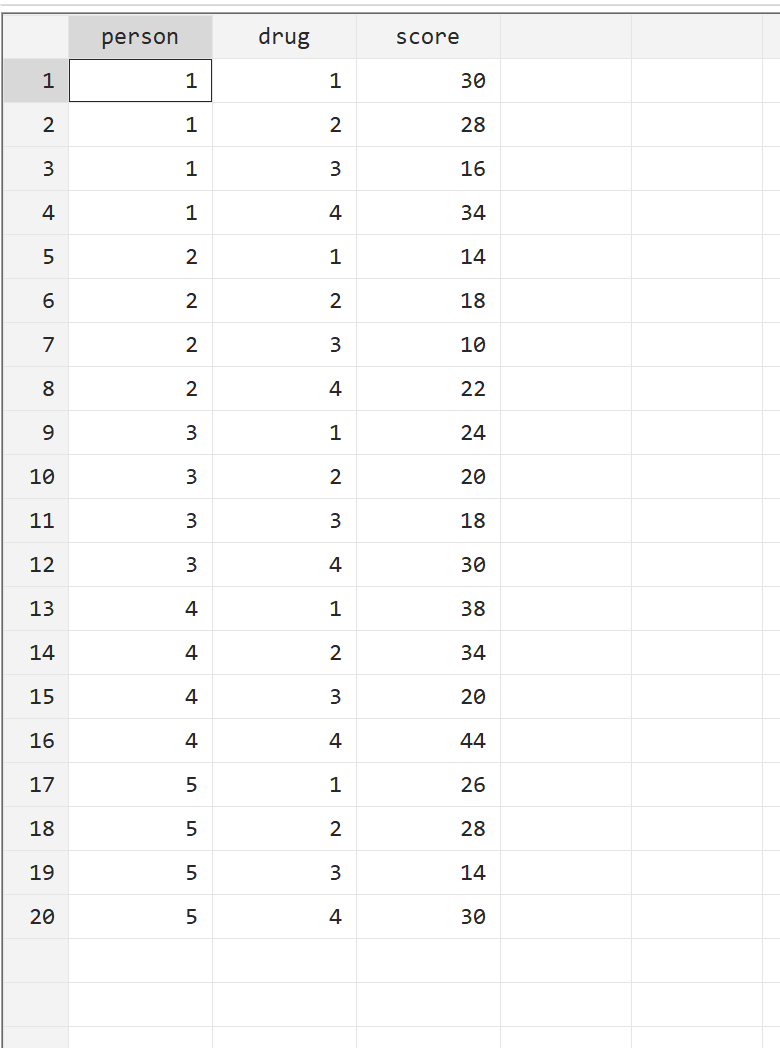
Researchers measure the reaction time of five patients on four different drugs. Since each patient is measured on each of the four drugs, we will use a repeated measures ANOVA to determine if the mean reaction time differs between drugs.
Perform the following steps to conduct the repeated measures ANOVA in Stata.
Step 1: Load the data.
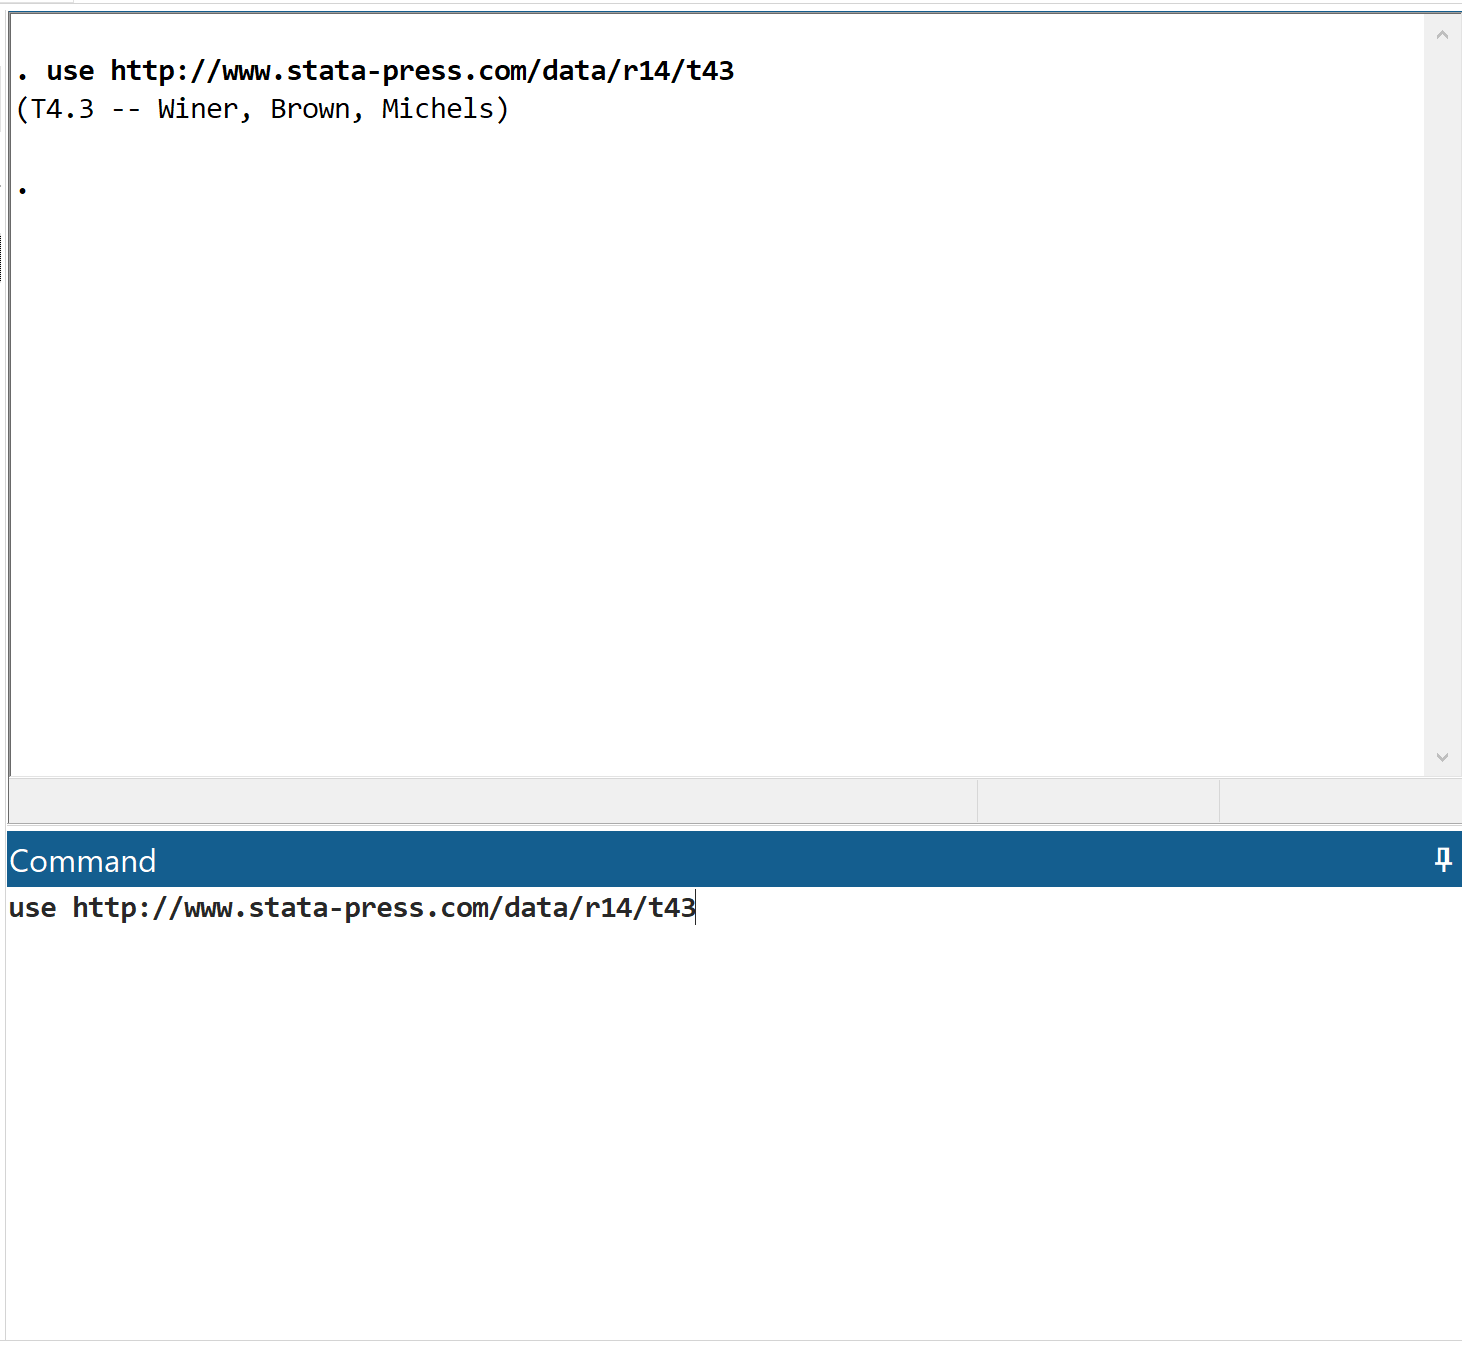
First, load the data by typing use https://www.stata-press.com/data/r14/t43 in the command box and clicking Enter.
Step 2: View the raw data.
Before we perform a repeated measures ANOVA, let’s first view the raw data. Along the top menu bar, go to Data > Data Editor > Data Editor (Browse). This will show us the response times for each of the 5 patients on each of the four drugs:
Step 3: Perform a repeated measures ANOVA.
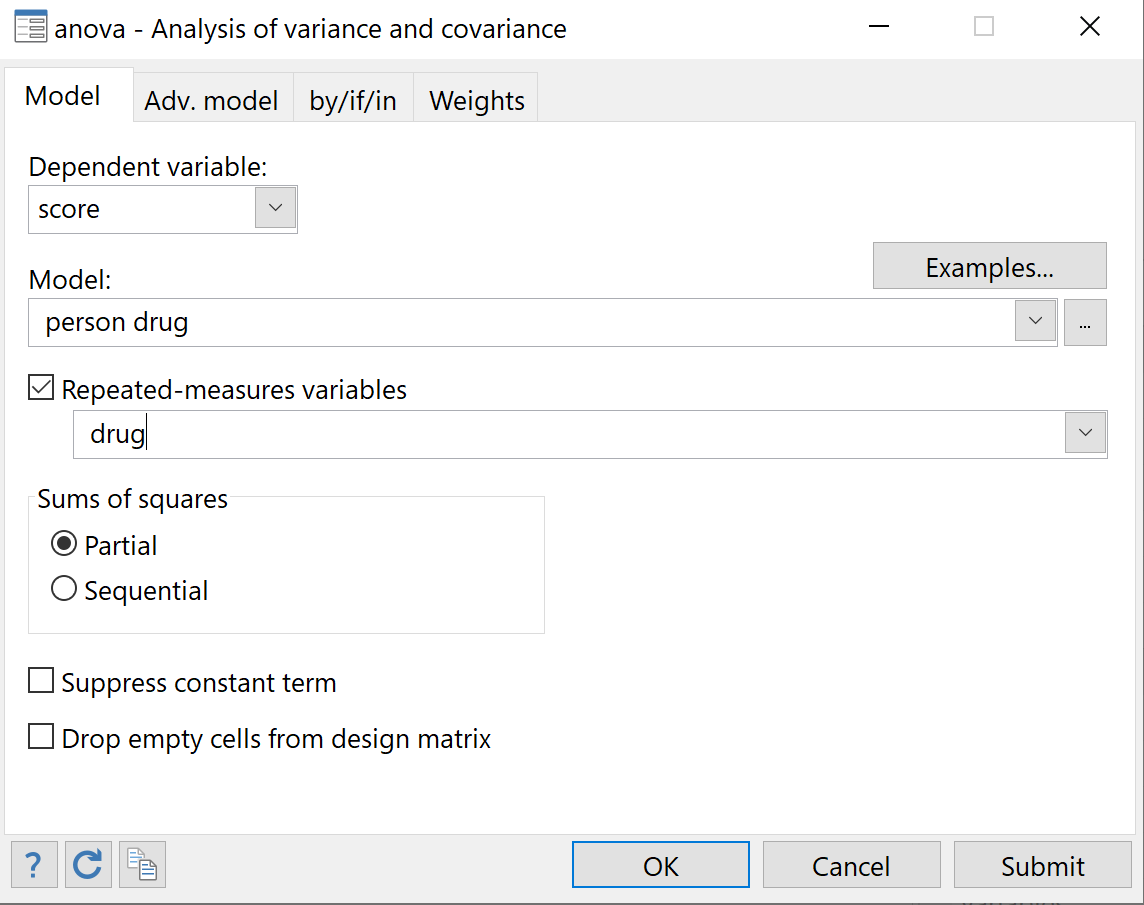
Along the top menu bar, go to Statistics > Linear models and related > ANOVA/MANOVA > Analysis of variance and covariance.
For Dependent variable, choose score. For Model, choose person and drug as the two explanatory variables. Check the box that says Repeated-measures variables and choose drug as the variable that repeats. Leave everything else as it is and click OK.
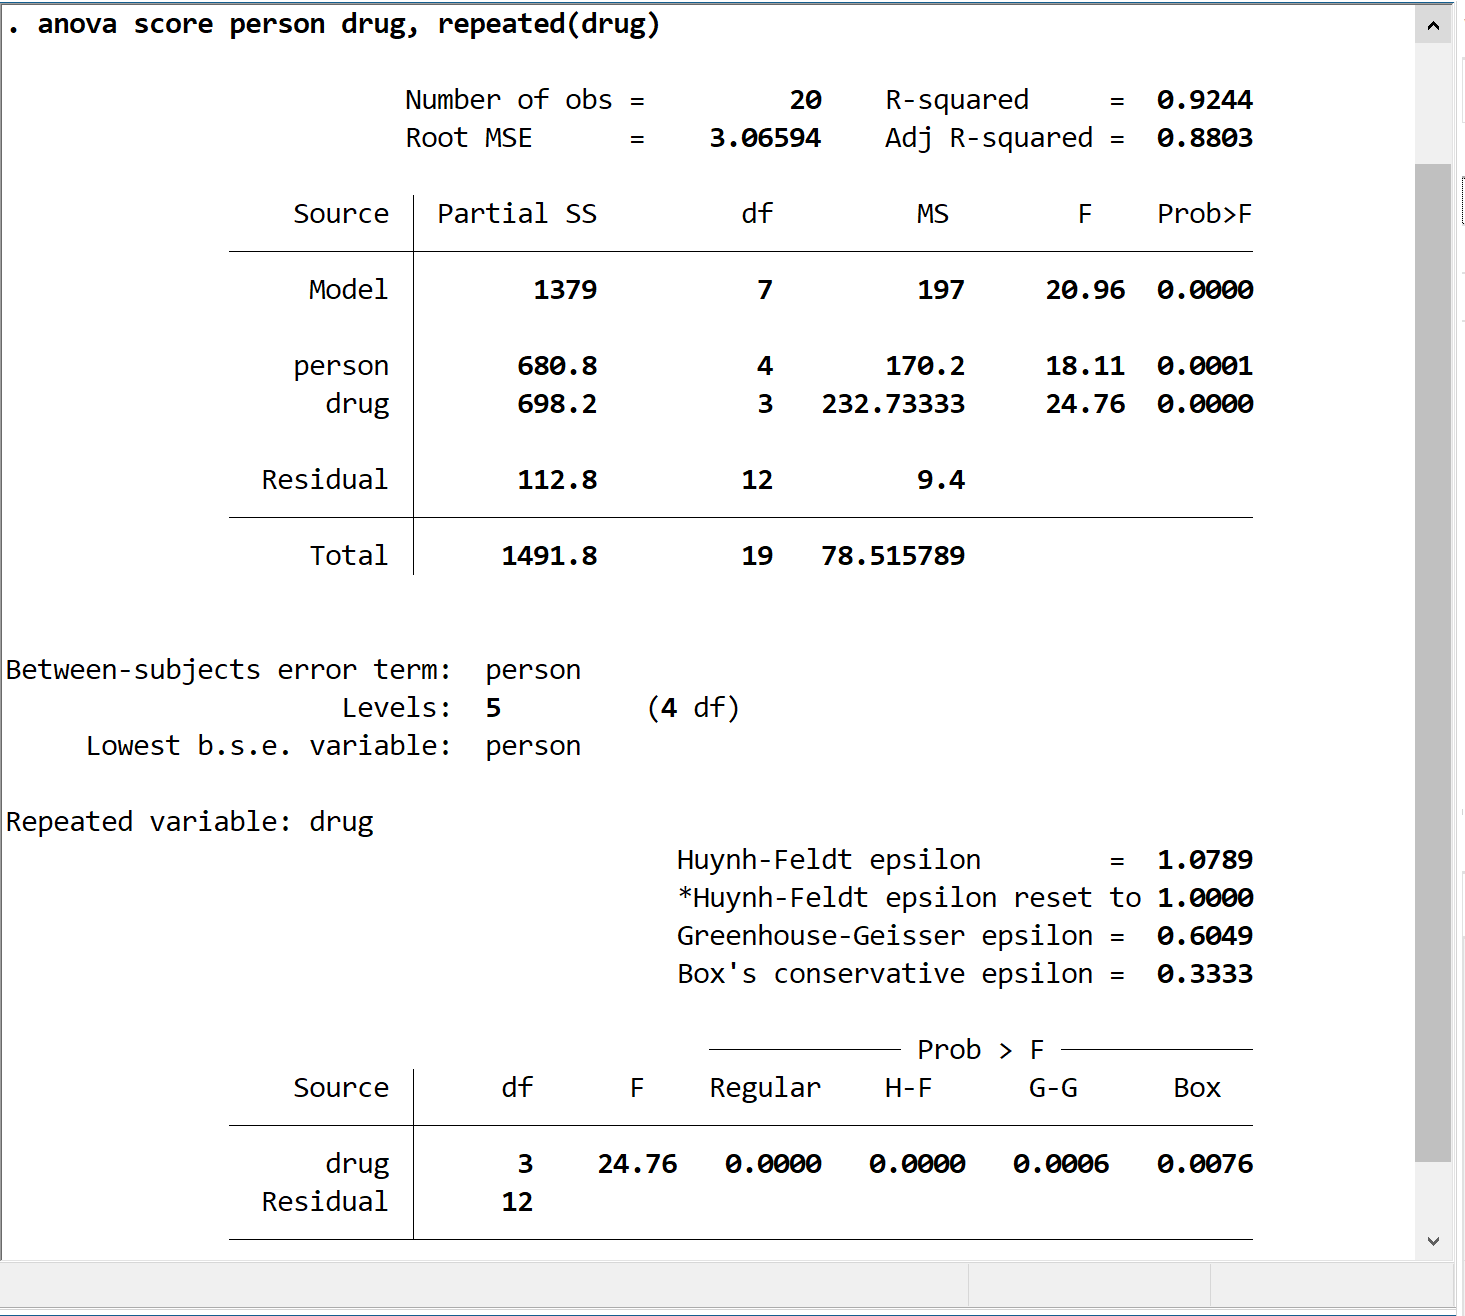
This will automatically produce the following two tables that show the results for the repeated measures ANOVA:
In the first table we are interested in the F value and the p-value (displayed as Prob>F) for the drug variable. Notice that F = 24.76 and the p-value is 0.000. This indicates there is a statistically significant difference among the mean scores for the four drugs.
The second table should only be used if we suspect that the sphericity assumption has been violated. This is the assumption that the variances of the differences between all pairwise combinations of groups must be equal. If we believe this assumption has been violated then we can use one of the three correction factors – Hunyh-Feldt epsilon, Greenhouse-Geisser epsilon, or Box’s conservative epsilon.
The p-value for the variable drug is shown for each of these three correction factors:
- Hunyh-Feldt (H-F) p-value = 0.000
- Greenhouse-Geisser (G-G) p-value = 0.0006
- Box’s conservative (Box) p-value = 0.0076
Notice that each of the p-values is less than 0.05, so there is still a statistically significant difference among the mean scores for the four drugs no matter which correction factor we use.
Step 4: Report the results.
Lastly, we will report the results of our repeated measures ANOVA. Here is an example of how to do so:
A one-way repeated measures ANOVA was conducted on 5 individuals to examine the effect that four different drugs had on response time.
Results showed that the type of drug used lead to statistically significant differences in response time (F(3, 12) = 24.75, p


