A repeated measures ANOVA is used to determine whether or not there is a statistically significant difference between the means of three or more groups in which the same subjects show up in each group.
This tutorial provides a step-by-step example of how to perform a repeated measures ANOVA in Google Sheets.
Step 1: Install the XLMiner Analysis ToolPak
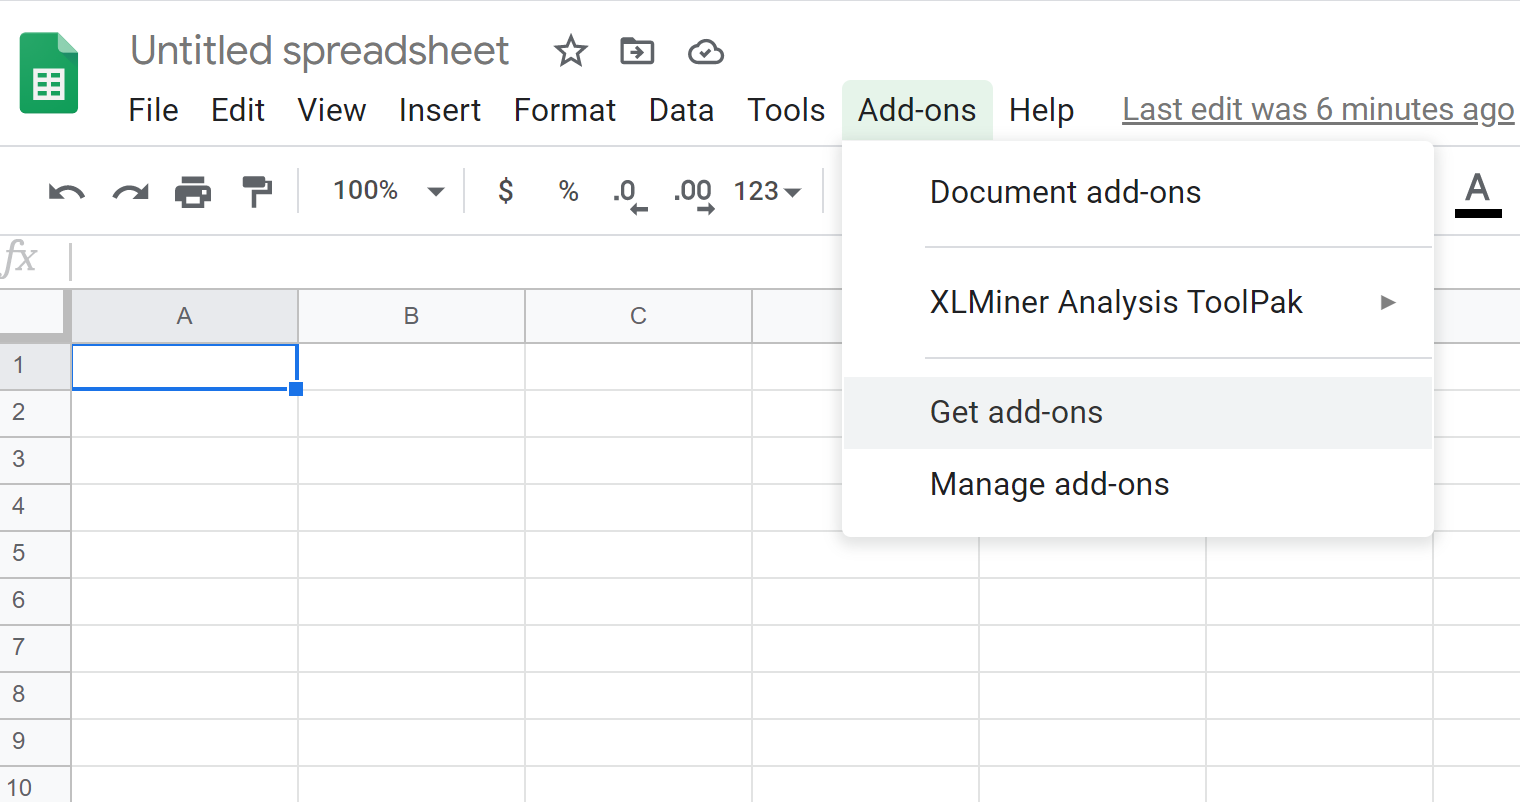
To perform a one-way ANOVA in Google Sheets, we need to first install the free XLMiner Analysis Toolpak.
To do so, click Add-ons > Get add-ons:
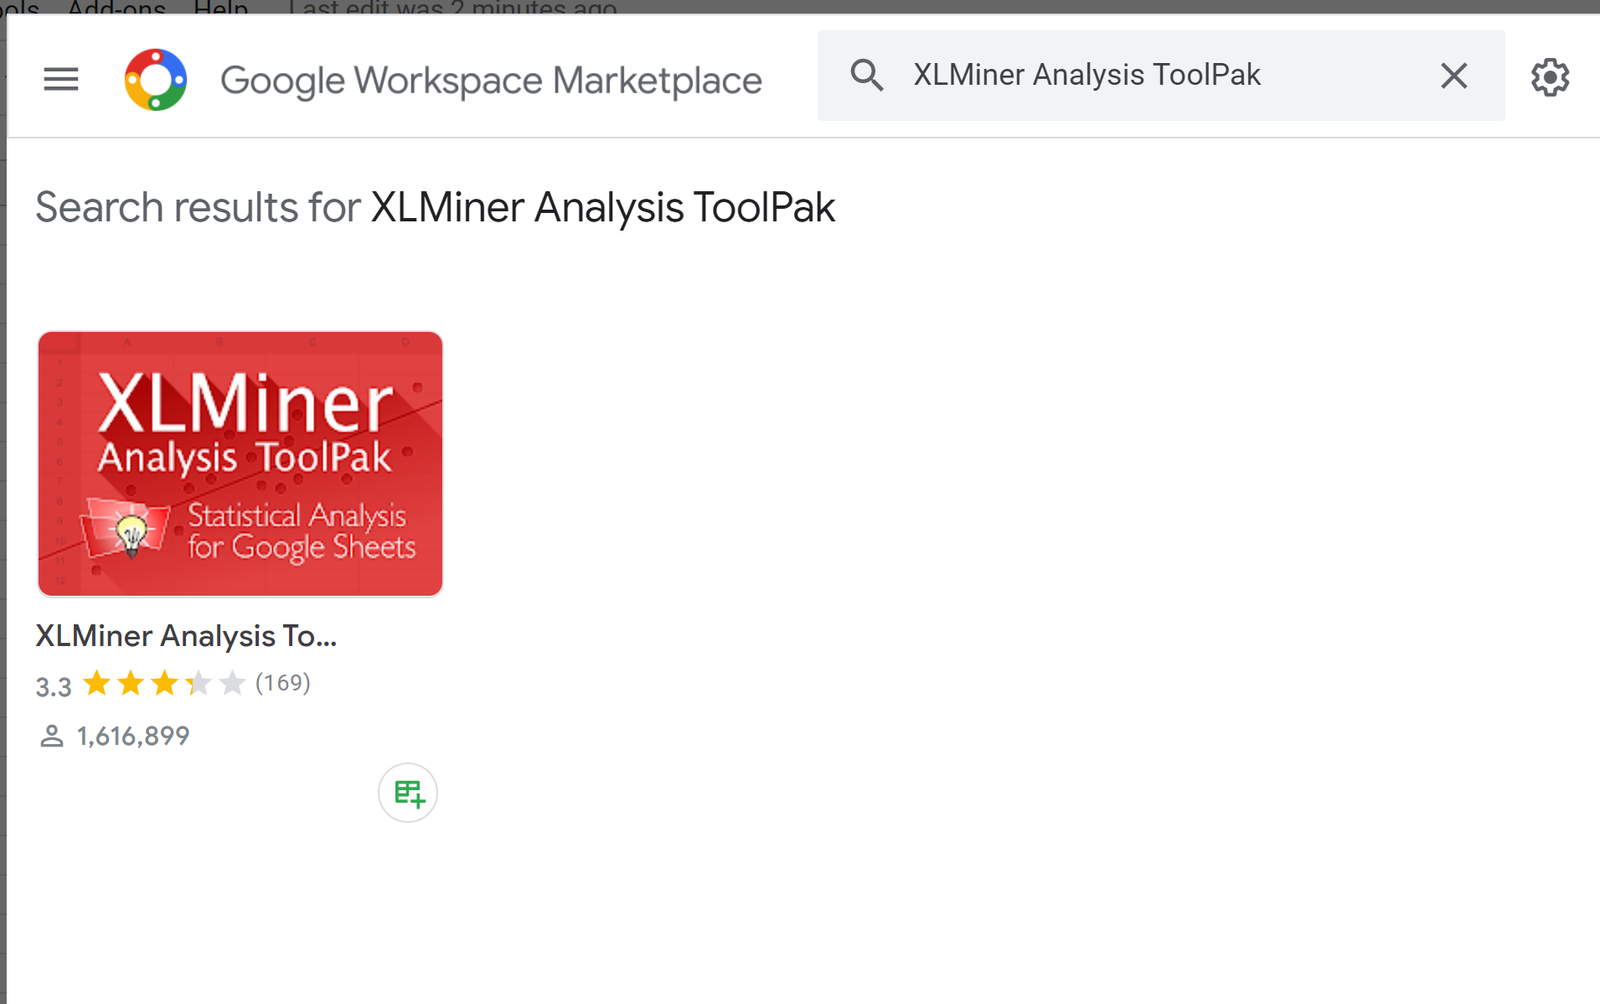
Next, type XLMiner Analysis ToolPak in the search bar and click the icon that appears:
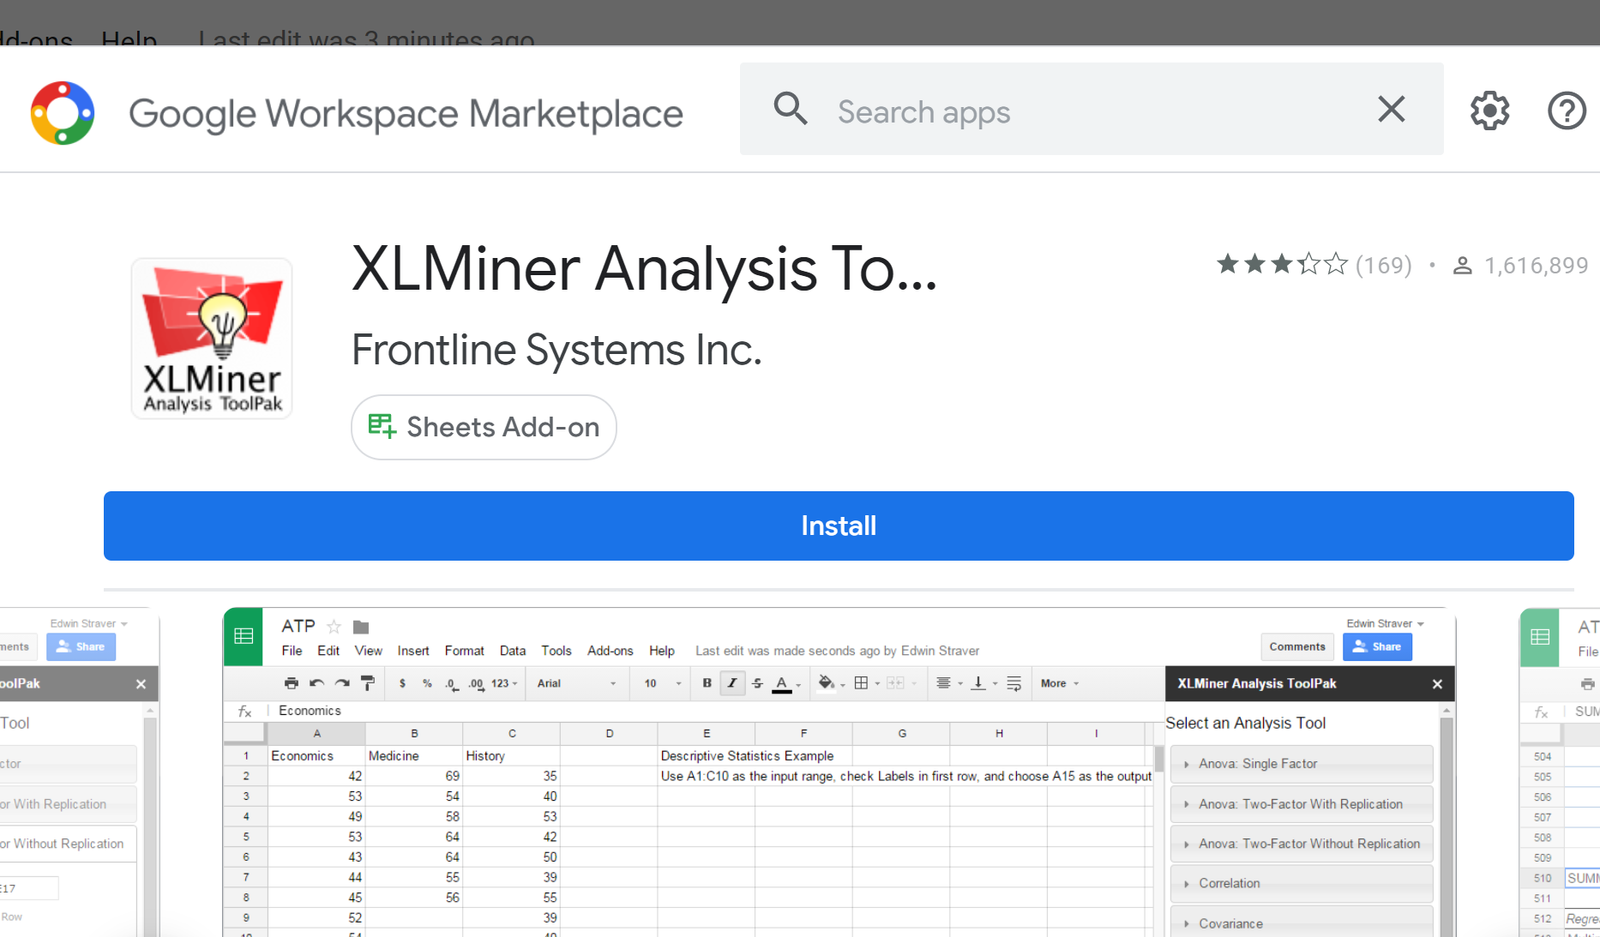
Lastly, click the Install button.
Step 2: Enter the Data
Next, we need to enter the data to use for the repeated measures ANOVA.
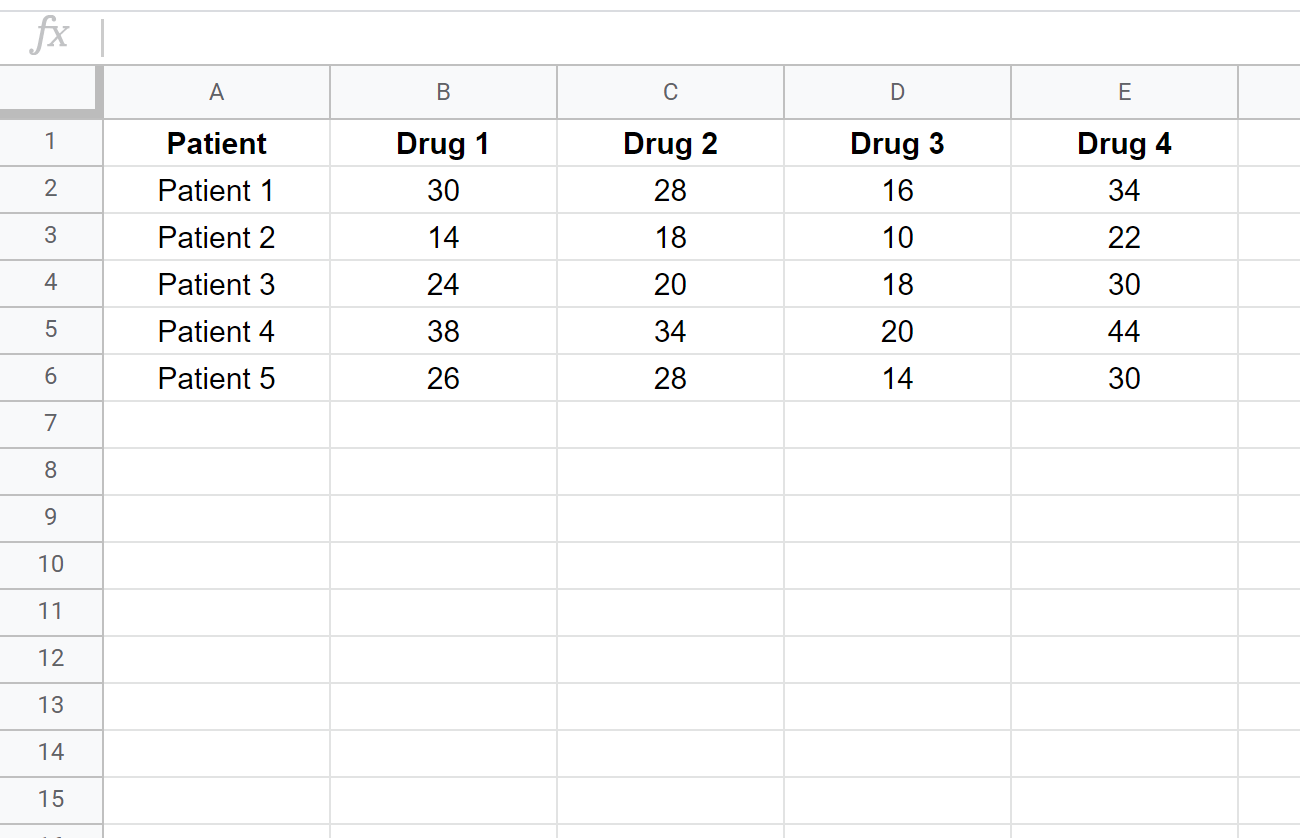
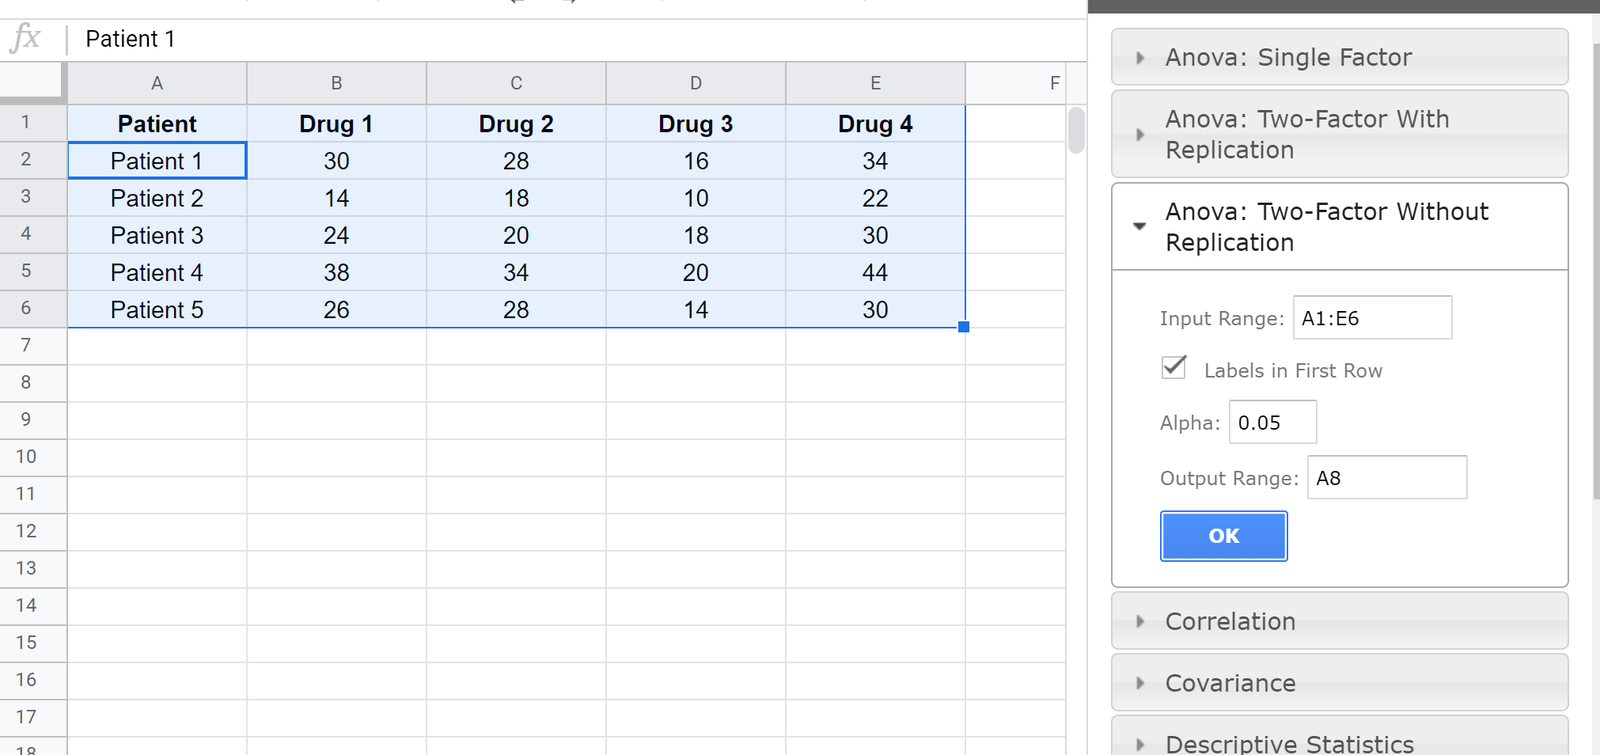
For this example, suppose researchers want to know if four different drugs lead to different reaction times. To test this, they measure the reaction time of five patients on the four different drugs.
The reaction times are shown below:
Step 3: Perform the Repeated Measures ANOVA
To perform a repeated measures ANOVA on this dataset, click Add-ons > XLMiner Analysis ToolPak > Start. The Analysis ToolPak will appear on the right side of the screen.
Click Anova: Two-Factor Without Replication and fill in the following information:
Step 4: Interpret the Results
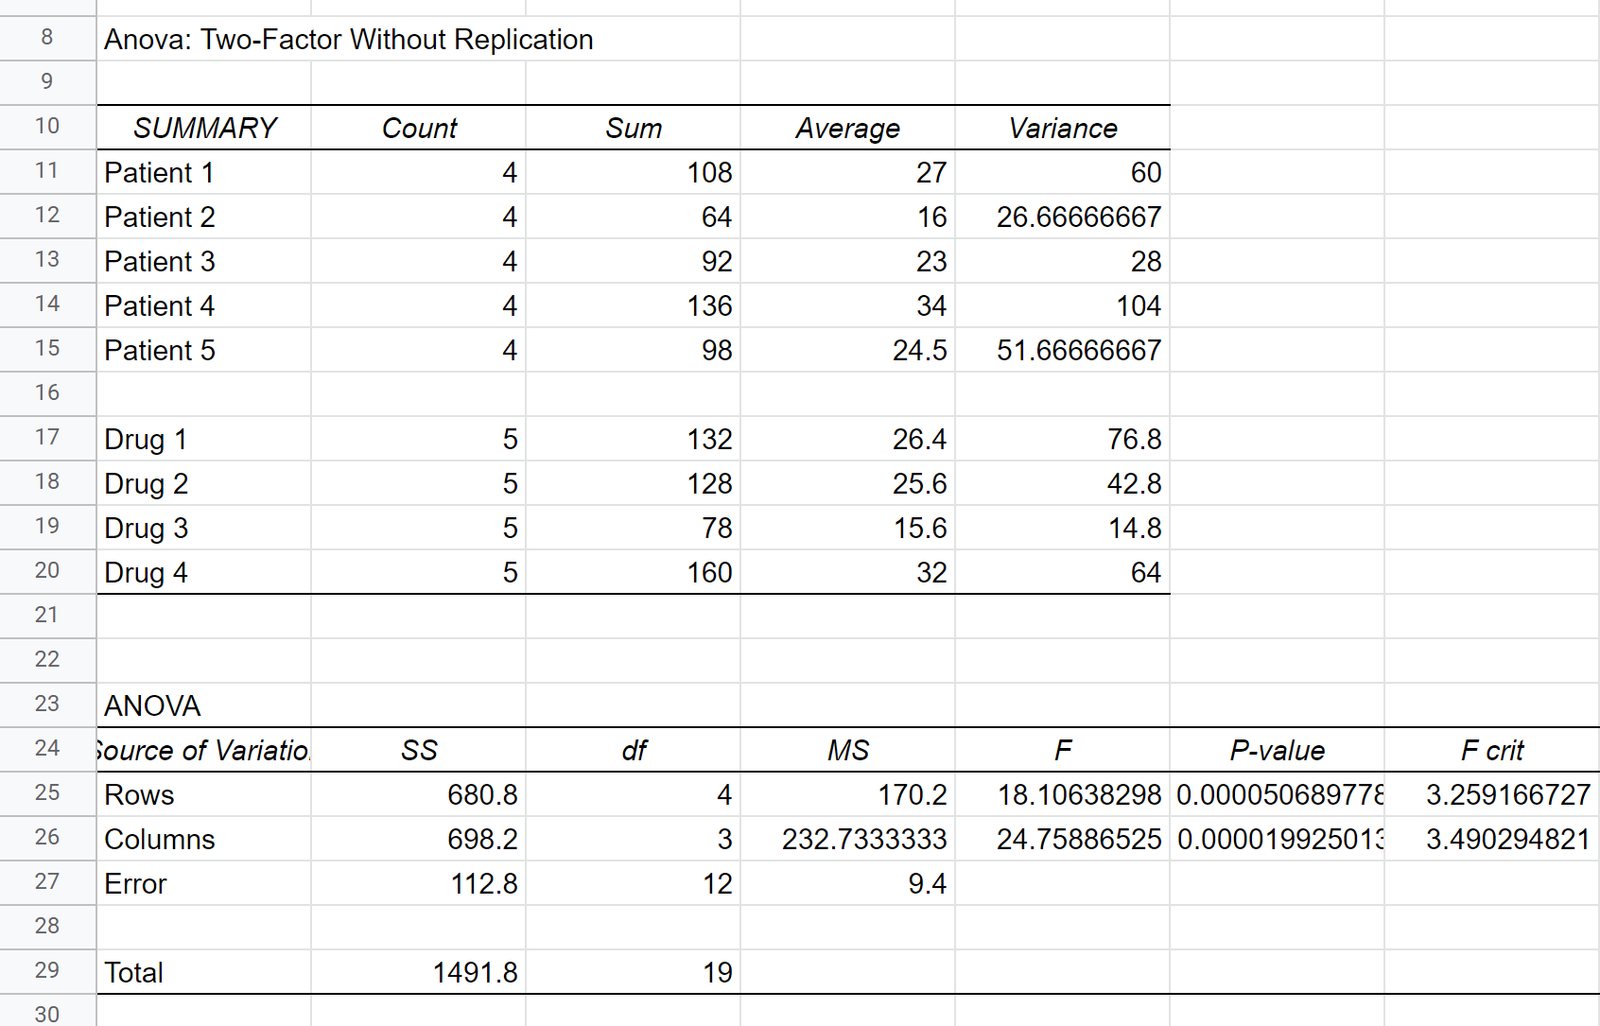
Once you click OK, the results of the repeated measures ANOVA will appear starting in the cell you specified in Output Range. In our case, we chose to display the results starting in cell A8:
In this case we are not interested in the results for the Rows, only for the Columns, which tell us the variation in response time based on the drug.
From the output we can see that the F test-statistic is 24.75887 and the corresponding p-value is 0.0000199.
Since this p-value is less than 0.05, we reject the null hypothesis and conclude that there is a statistically significant difference in mean response times between the four drugs.
Additional Resources
How to Perform a Repeated Measures ANOVA in Excel
How to Perform a Repeated Measures ANOVA By Hand
One-Way Repeated Measures ANOVA Calculator


