A repeated measures ANOVA is used to determine whether or not there is a statistically significant difference between the means of three or more groups in which the same subjects show up in each group.
This tutorial explains how to conduct a one-way repeated measures ANOVA in Excel.
Example: Repeated Measures ANOVA in Excel
Researchers want to know if four different drugs lead to different reaction times. To test this, they measure the reaction time of five patients on the four different drugs. Since each patient is measured on each of the four drugs, we will use a repeated measures ANOVA to determine if the mean reaction time differs between drugs.
Perform the following steps to conduct the repeated measures ANOVA in Excel.
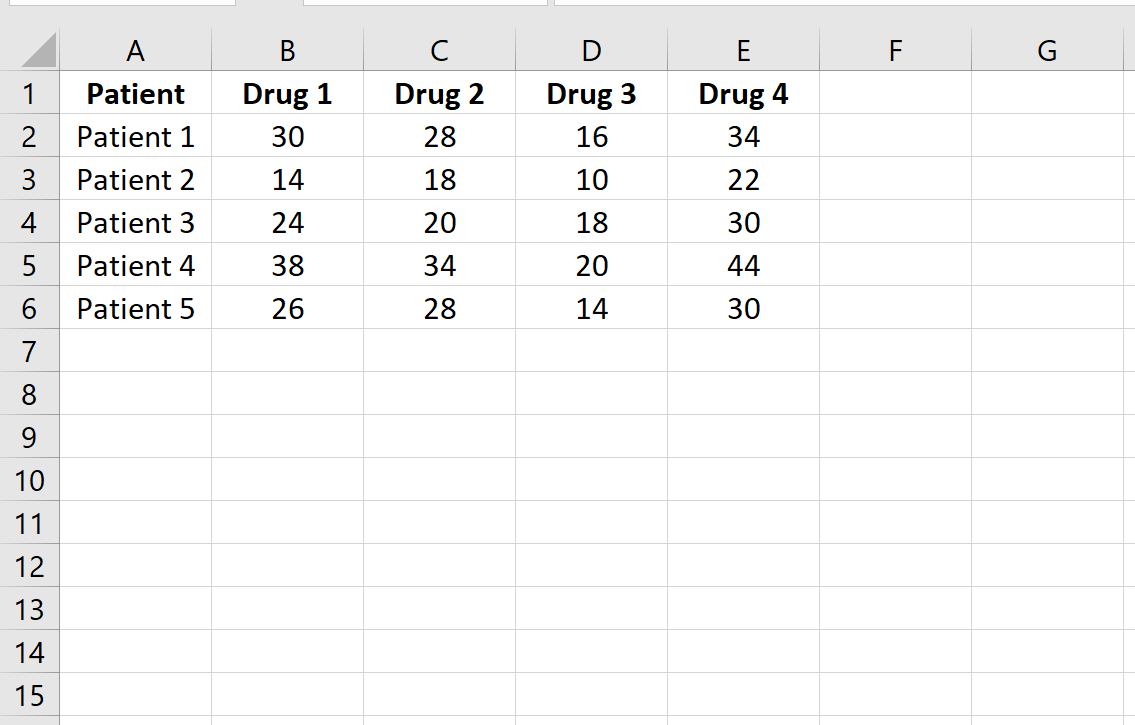
Step 1: Enter the data.
Enter the following data, which shows the response time (in seconds) of five patients on the four drugs:
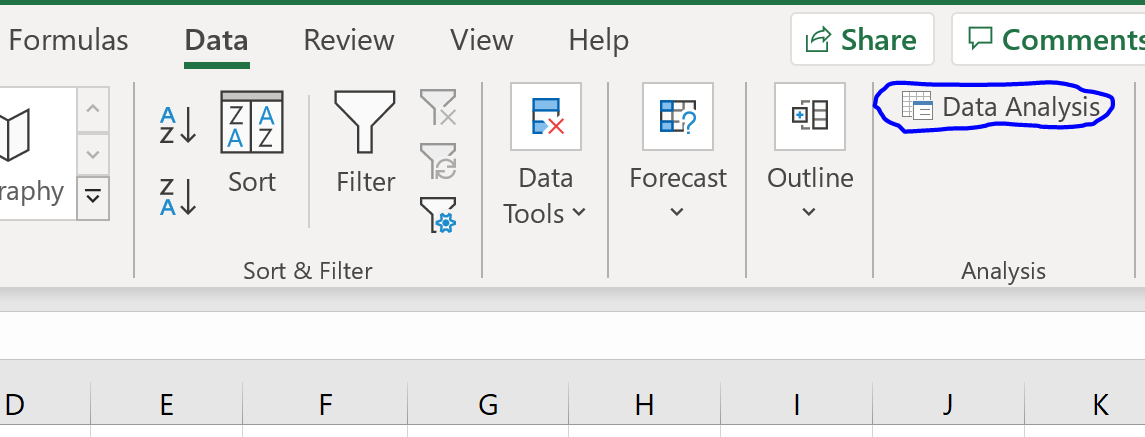
Step 2: Perform the repeated measures ANOVA.
To perform the repeated measures ANOVA, go to the Data tab and click on Data Analysis. If you don’t see this option, then you need to first install the free Analysis ToolPak.
Once you click on Data Analysis, a new window will pop up. Select Anova: Two-Factor Without Replication and click OK.
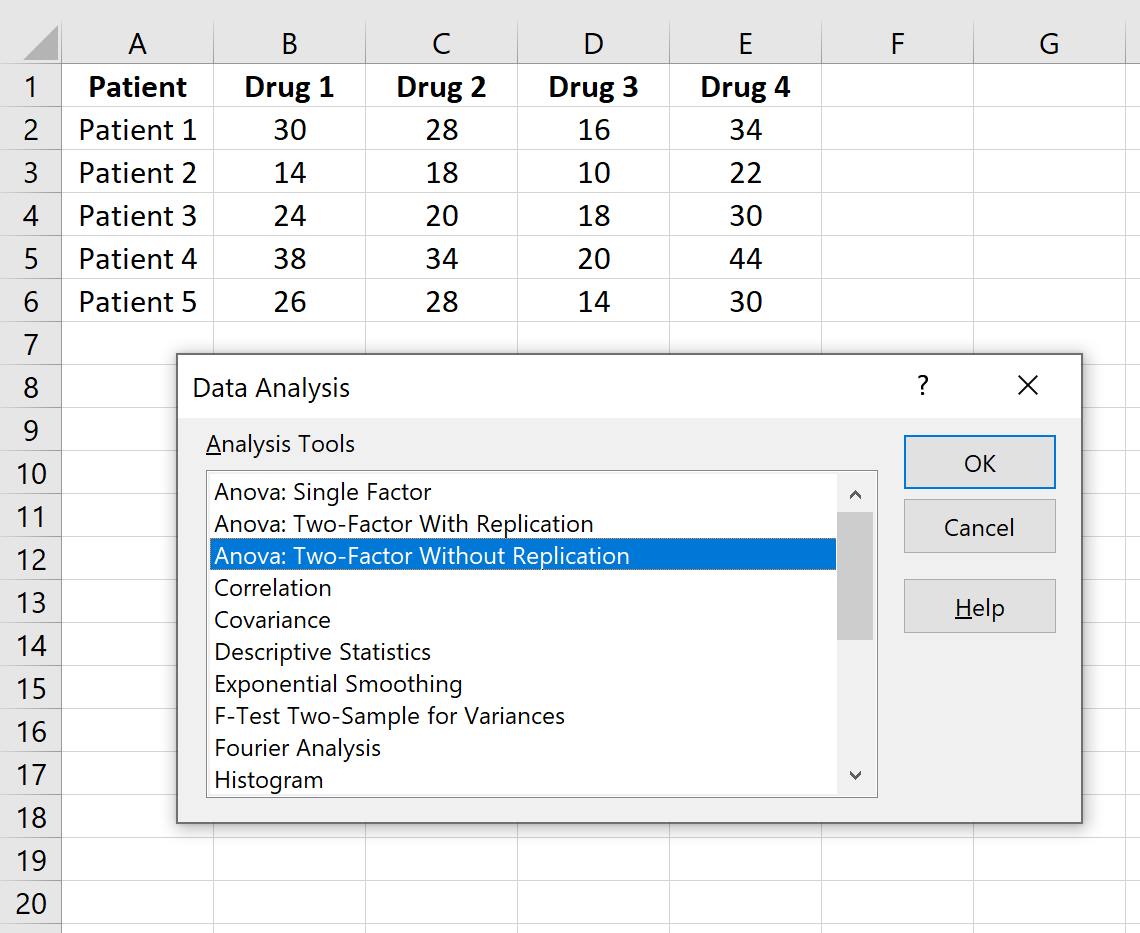
Note:
The Analysis Toolpak doesn’t have an explicit function to perform a repeated measures ANOVA, but the Anova: Two-Factor Without Replication will produce the results we’re looking for, as we’ll see in the output.
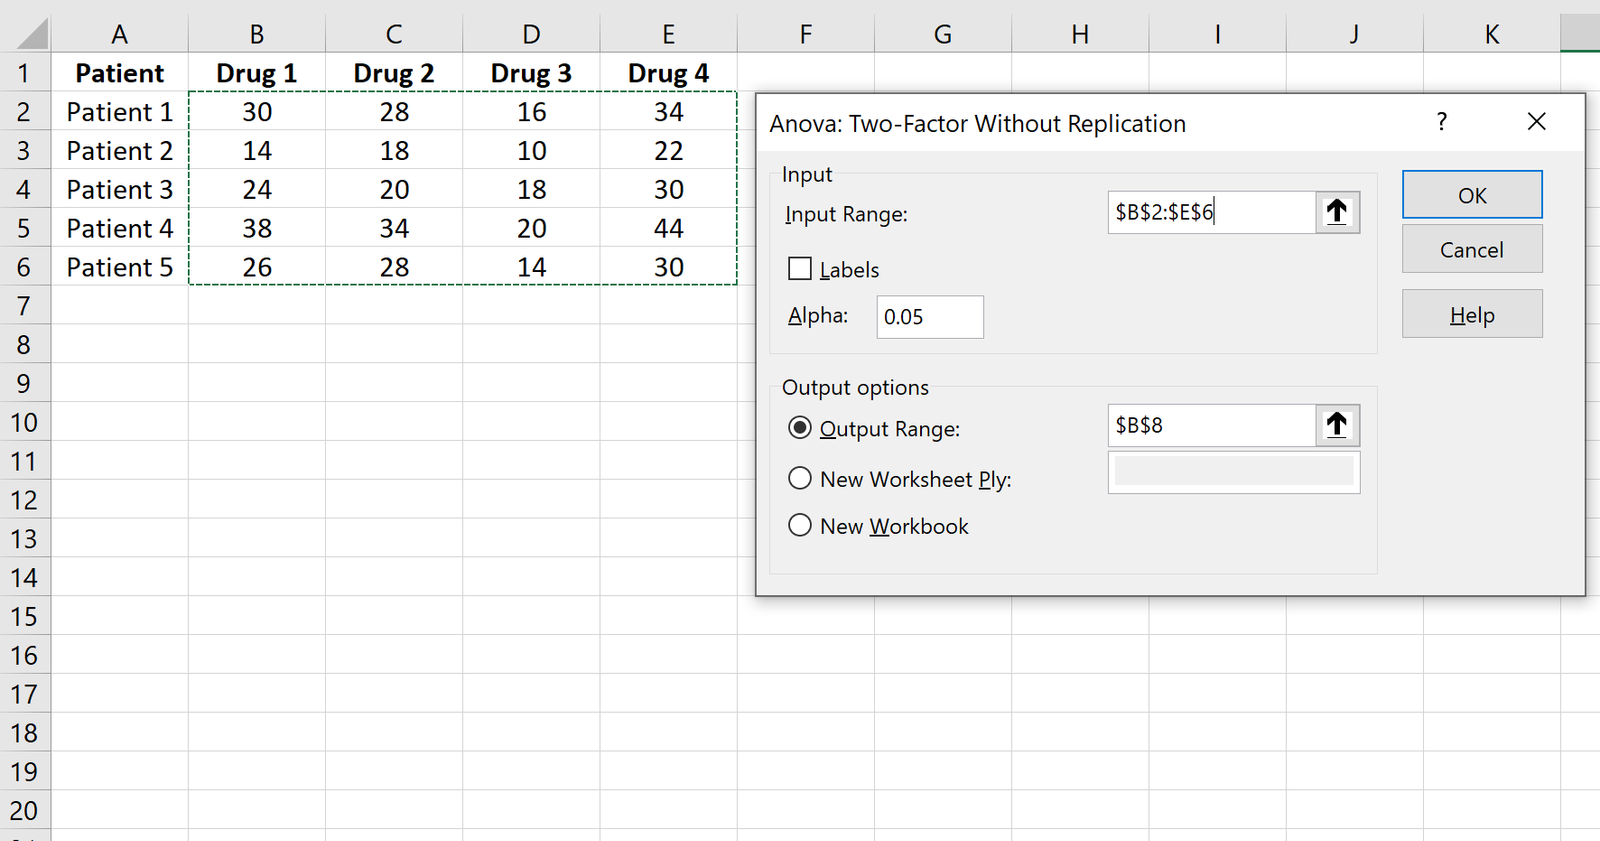
For Input Range, type in the cell range that contains the response times for the patients. Feel free to leave Alpha at 0.05, unless you wish to use a different significance level. For Output Range, choose a cell where you would like the results to appear. Then click OK.
The results will automatically appear:
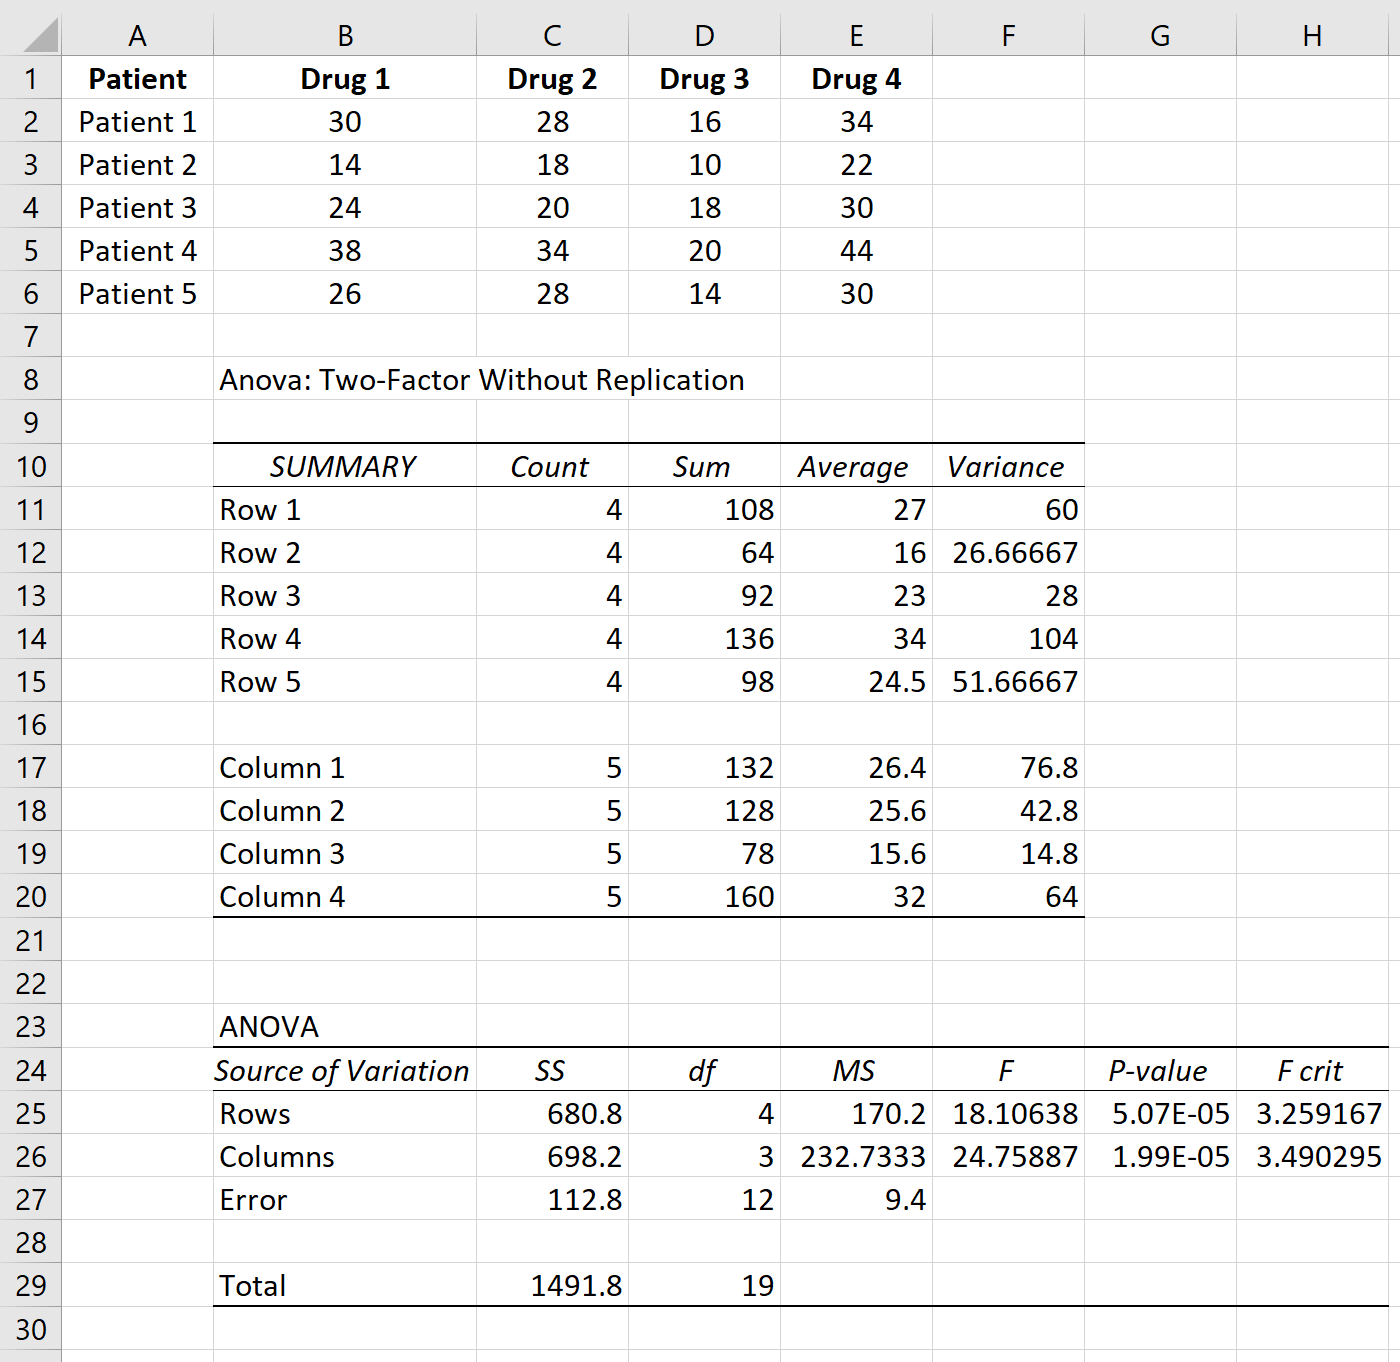
In this case we are not interested in the results for the Rows, only for the Columns, which tell us the variation in response time based on the drug.
The F test-statistic is 24.75887 and the corresponding p-value is 0.0000199. Since this p-value is less than 0.05, we reject the null hypothesis and conclude that there is a statistically significant difference in mean response times between the four drugs.
Step 3: Report the results.
Lastly, we will report the results of our repeated measures ANOVA. Here is an example of how to do so:
A one-way repeated measures ANOVA was conducted on 5 individuals to examine the effect that four different drugs had on response time.
Results showed that the type of drug used lead to statistically significant differences in response time (F(3, 12) = 24.75887, p