You can use the following basic syntax to remove axis labels in ggplot2:
ggplot(df, aes(x=x, y=y))+
  geom_point() +
  theme(axis.text.x=element_blank(), #remove x axis labels
        axis.ticks.x=element_blank(), #remove x axis ticks
        axis.text.y=element_blank(),  #remove y axis labels
        axis.ticks.y=element_blank()  #remove y axis ticks
        )
The following examples show how to use this syntax in practice.
Example 1: Remove X-Axis Labels
The following code shows how to remove x-axis labels from a scatterplot in ggplot2:
library(ggplot2)

#create data frame
df frame(x=c(1, 2, 3, 4, 5, 6, 7, 8, 9, 10),
                 y=c(11, 13, 15, 14, 19, 22, 28, 25, 30, 29))

#create scatterplot
ggplot(df, aes(x=x, y=y))+
  geom_point() +
  theme(axis.text.x=element_blank(),
        axis.ticks.x=element_blank()
        )
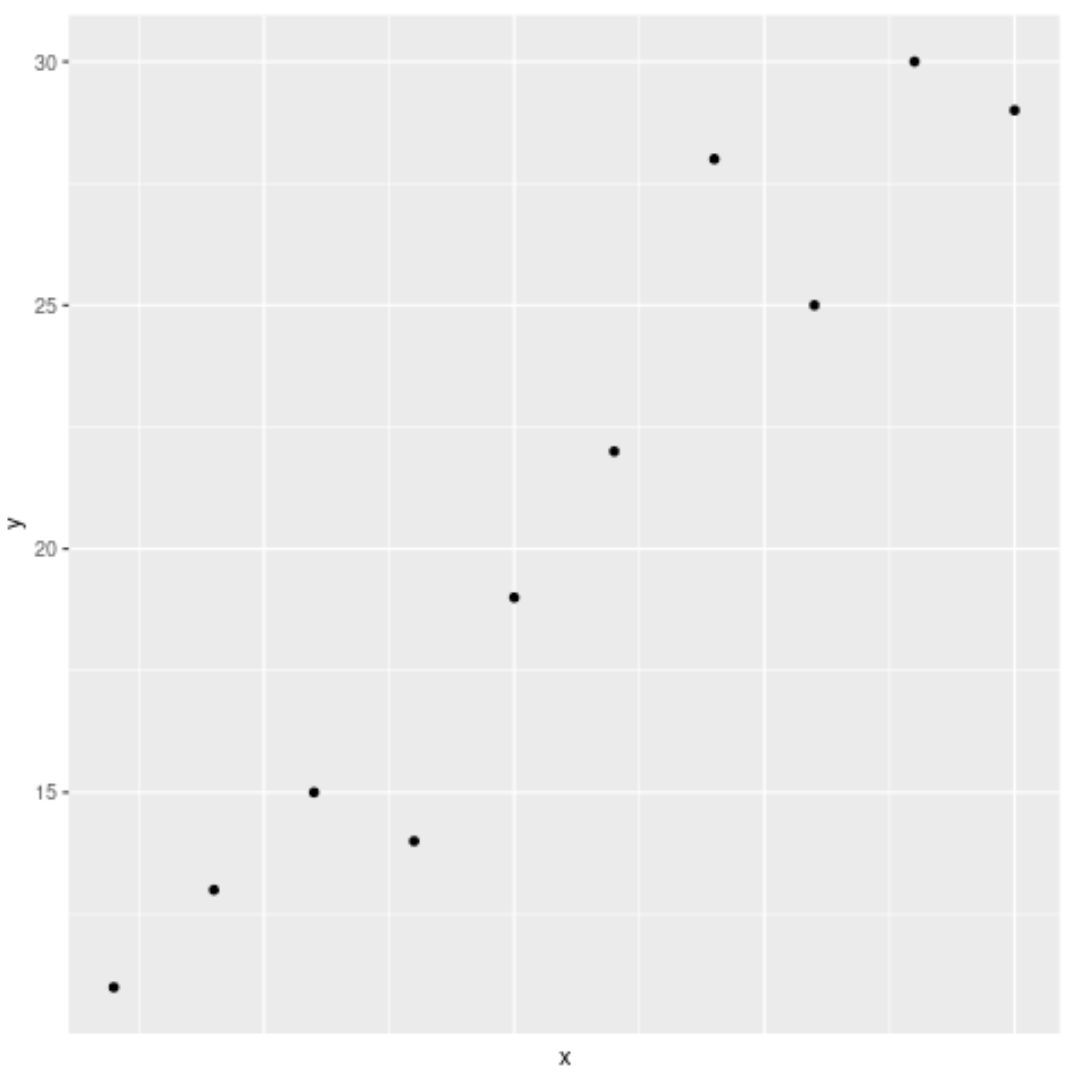
Notice that only the x-axis labels (and tick marks) have been removed.
Example 2: Remove Y-Axis Labels
The following code shows how to remove y-axis labels from a scatterplot in ggplot2:
library(ggplot2)

#create data frame
df frame(x=c(1, 2, 3, 4, 5, 6, 7, 8, 9, 10),
                 y=c(11, 13, 15, 14, 19, 22, 28, 25, 30, 29))

#create scatterplot
ggplot(df, aes(x=x, y=y))+
  geom_point() +
  theme(axis.text.y=element_blank(),
        axis.ticks.y=element_blank()
        )
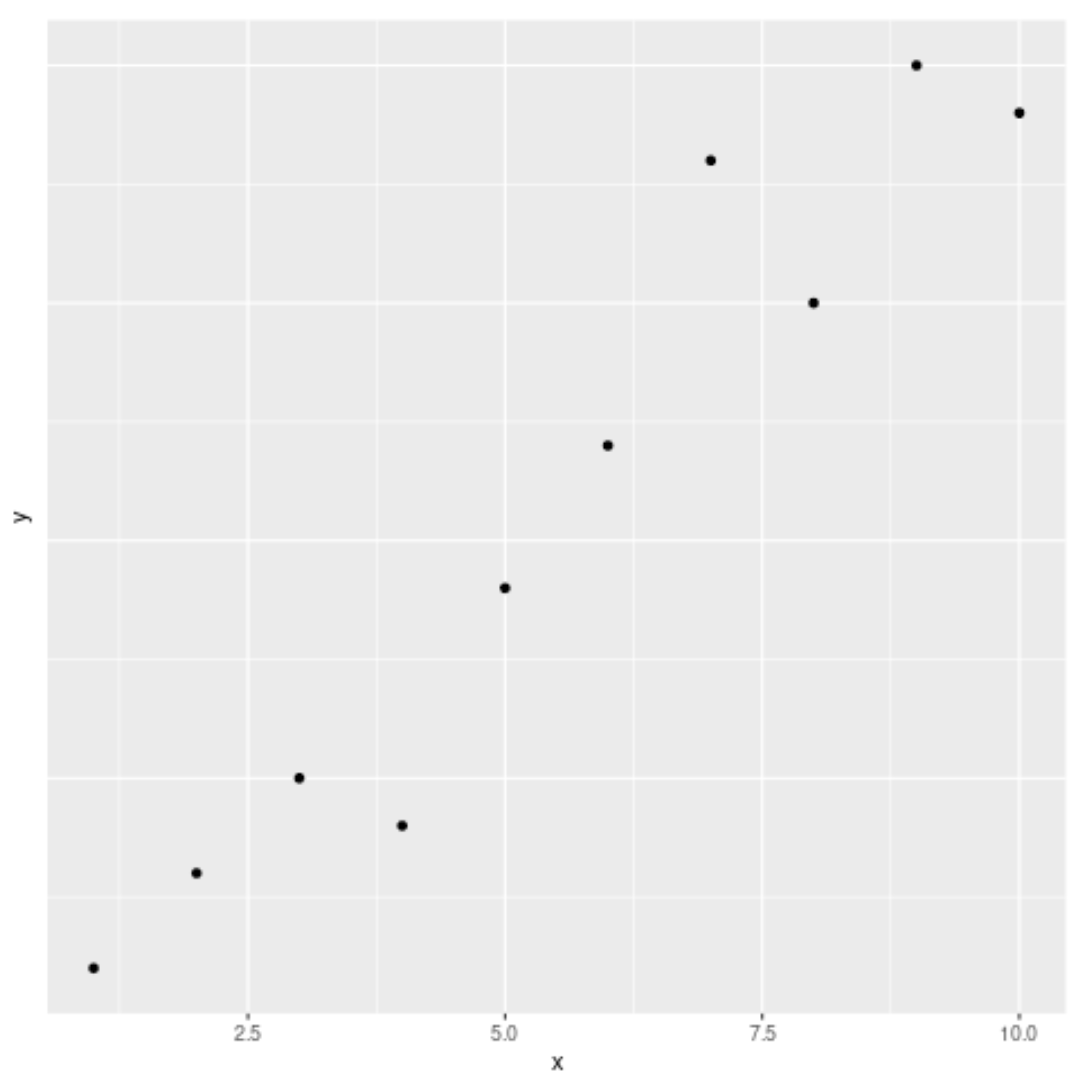
Notice that just the y-axis labels (and tick marks) have been removed.
Example 3: Remove Both Axis Labels
The following code shows how to remove labels from both axes in a scatterplot in ggplot2:
library(ggplot2)

#create data frame
df frame(x=c(1, 2, 3, 4, 5, 6, 7, 8, 9, 10),
                 y=c(11, 13, 15, 14, 19, 22, 28, 25, 30, 29))

#create scatterplot
ggplot(df, aes(x=x, y=y))+
  geom_point() +
  theme(axis.text.x=element_blank(),
        axis.ticks.x=element_blank(),
        axis.text.y=element_blank(),
        axis.ticks.y=element_blank()
        )

The labels and tick marks on both axes have been removed.
Additional Resources
The following tutorials explain how to perform other common functions in ggplot2:
How to Remove a Legend in ggplot2
How to Remove Gridlines in ggplot2
How to Rotate Axis Labels in ggplot2