A random variable, typically denoted as X, is a variable whose possible values are outcomes of a random process.
There are two types of random variables: discrete and continuous.
Discrete Random Variables
A discrete random variable is a variable which can take on only a countable number of distinct values like 0, 1, 2, 3, 4, 5…100, 1 million, etc. Some examples of discrete random variables include:
- The number of times a coin lands on tails after being flipped 20 times.
- The number of times a dice lands on the number 4 after being rolled 100 times.
- The number of defective widgets in a box of 50 widgets.
A probability distribution for a discrete random variable tells us the probability that the random variable takes on certain values.
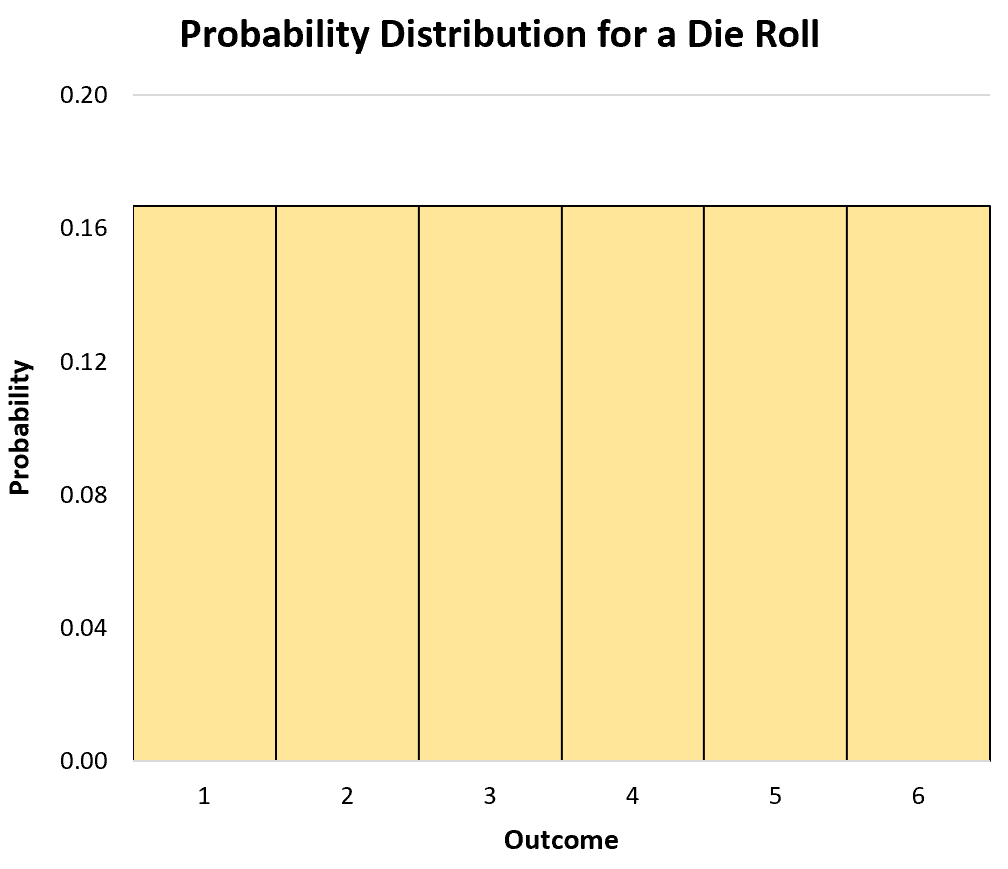
For example, suppose we roll a fair die one time. If we let X denote the probability that the die lands on a certain number, then the probability distribution can be written as:
- P(X=1): 1/6
- P(X=2): 1/6
- P(X=3): 1/6
- P(X=4): 1/6
- P(X=5): 1/6
- P(X=6): 1/6
Note:
For a probability distribution to be valid, it must satisfy the following two criteria:
1. The probability for each outcome must be between 0 and 1.
2. The sum of all of the probabilities must add up to 1.
Notice that the probability distribution for the die roll satisfies both of these criteria:
1. The probability for each outcome is between 0 and 1.
2. The sum of all of the probabilities add up to 1.
We can use a histogram to visualize the probability distribution:
A cumulative probability distribution for a discrete random variable tells us the probability that the variable takes on a value equal to or less than some value.
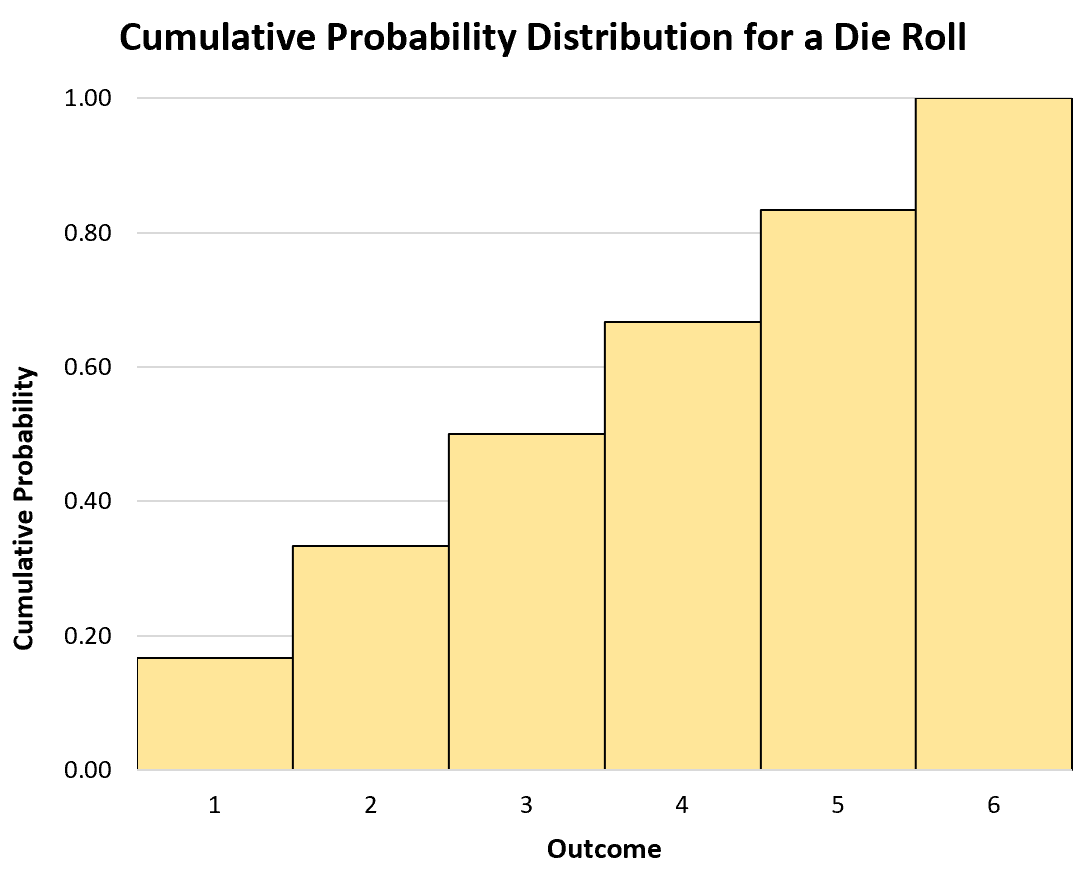
For example, the cumulative probability distribution for a die roll would look like:
- P(X≤1): 1/6
- P(X≤2): 2/6
- P(X≤3): 3/6
- P(X≤4): 4/6
- P(X≤5): 5/6
- P(X≤6): 6/6
The probability that the die lands on a one or less is simply 1/6, since it can’t land on a number less than one.
The probability that it lands on a two or less is P(X=1) + P(X=2) = 1/6 + 1/6 = 2/6.
Similarly, the probability that it lands on a three or less is P(X=1) + P(X=2) + P(X=3) = 1/6 + 1/6 + 1/6 = 3/6, and so on.
We can also use a histogram to visualize the cumulative probability distribution:
Continuous Random Variables
A continuous random variable is a variable which can take on an infinite number of possible values. Some examples of continuous random variables include:
- Weight of an animal
- Height of a person
- Time required to run a marathon
For example, the height of a person could be 60.2 inches, 65.2344 inches, 70.431222 inches, etc. There are an infinite amount of possible values for height.
Rule of Thumb:
If you can count the number of outcomes, then you are working with a discrete random variable – e.g. counting the number of times a coin lands on heads.
But if you can measure the outcome, you are working with a continuous random variable – e.g. measuring height, weight, time, etc.
A probability distribution for a continuous random variable tells us the probability that the random variable takes on certain values.
However, unlike a probability distribution for discrete random variables, a probability distribution for a continuous random variable can only be used to tell us the probability that the variable takes on a range of values.
For example, suppose we want to know the probability that a burger from a particular restaurant weighs a quarter-pound (0.25 lbs). Since weight is a continuous variable, it can take on an infinite number of values.
For example, a given burger might actually weight 0.250001 pounds, or 0.24 pounds, or 0.2488 pounds. The probability that a given burger weights exactly .25 pounds is essentially zero.
Thus, we could only use a probability distribution to tell us the probability that a burger weighs less than 0.25 lbs, more than 0.25 lbs, or between some range (e.g between .23 lbs and .27 lbs).
Additional Resources
The following tutorials provide additional information about random variables:
What Are i.i.d. Random Variables?
10 Examples of Random Variables in Real Life