You can use the following syntax to change the font size of various elements in base R plots:
plot(df$x, df$y, main='Title', sub='Subtitle',
     cex.main=2, #change font size of title
     cex.sub=2, #change font size of subtitle
     cex.lab=2, #change font size of axis labels
     cex.axis=2) #change font size of axis text
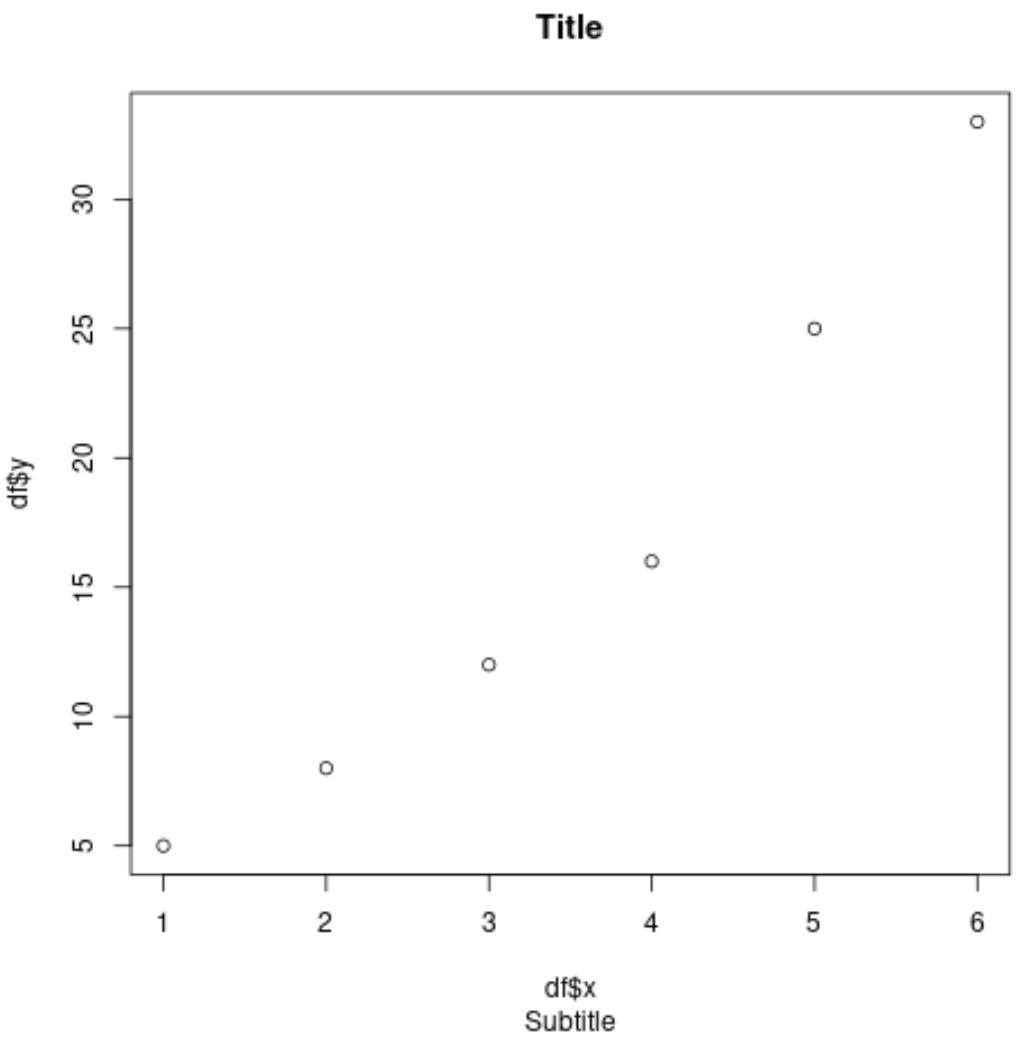
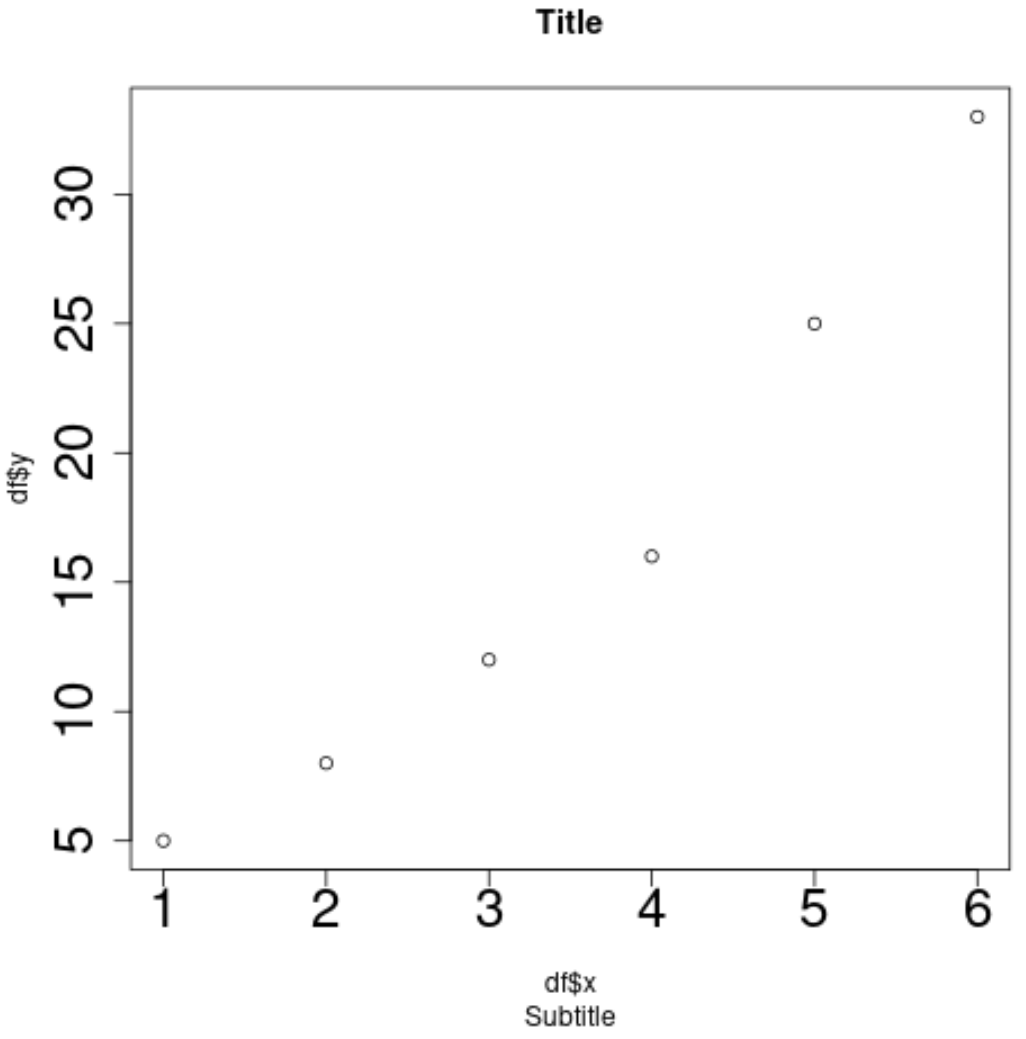
The following examples show how to use this syntax with the following scatterplot in base R:
#create data frame
df frame(x=c(1, 2, 3, 4, 5, 6),
                 y=c(5, 8, 12, 16, 25, 33))

#create scatterplot with all default font sizes
plot(df$x, df$y, main='Title', sub='Subtitle')
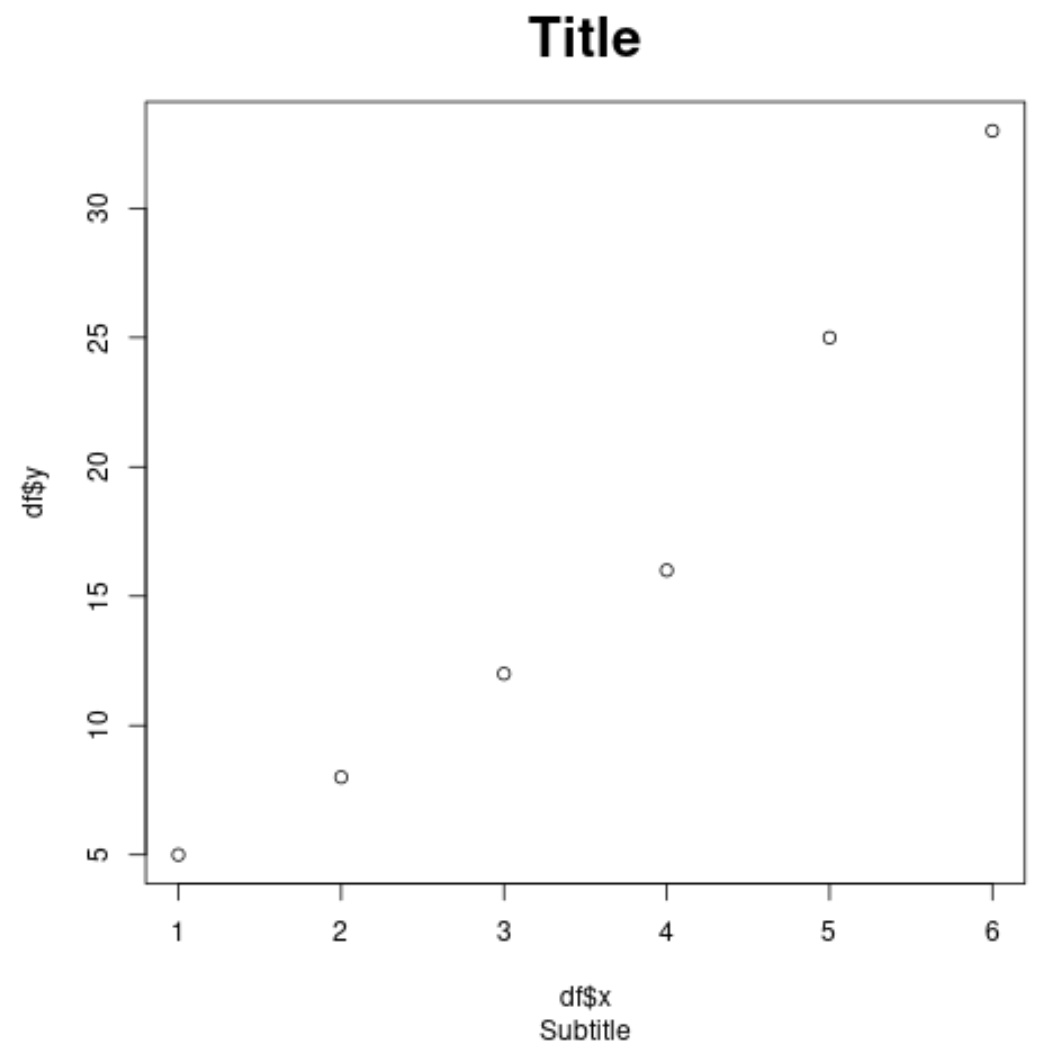
Example 1: Change Font Size of Title
The following code shows how to change the font size of the title of the plot:
#create scatterplot with increased font size of title
plot(df$x, df$y, main='Title', sub='Subtitle'.
     cex.main=2)
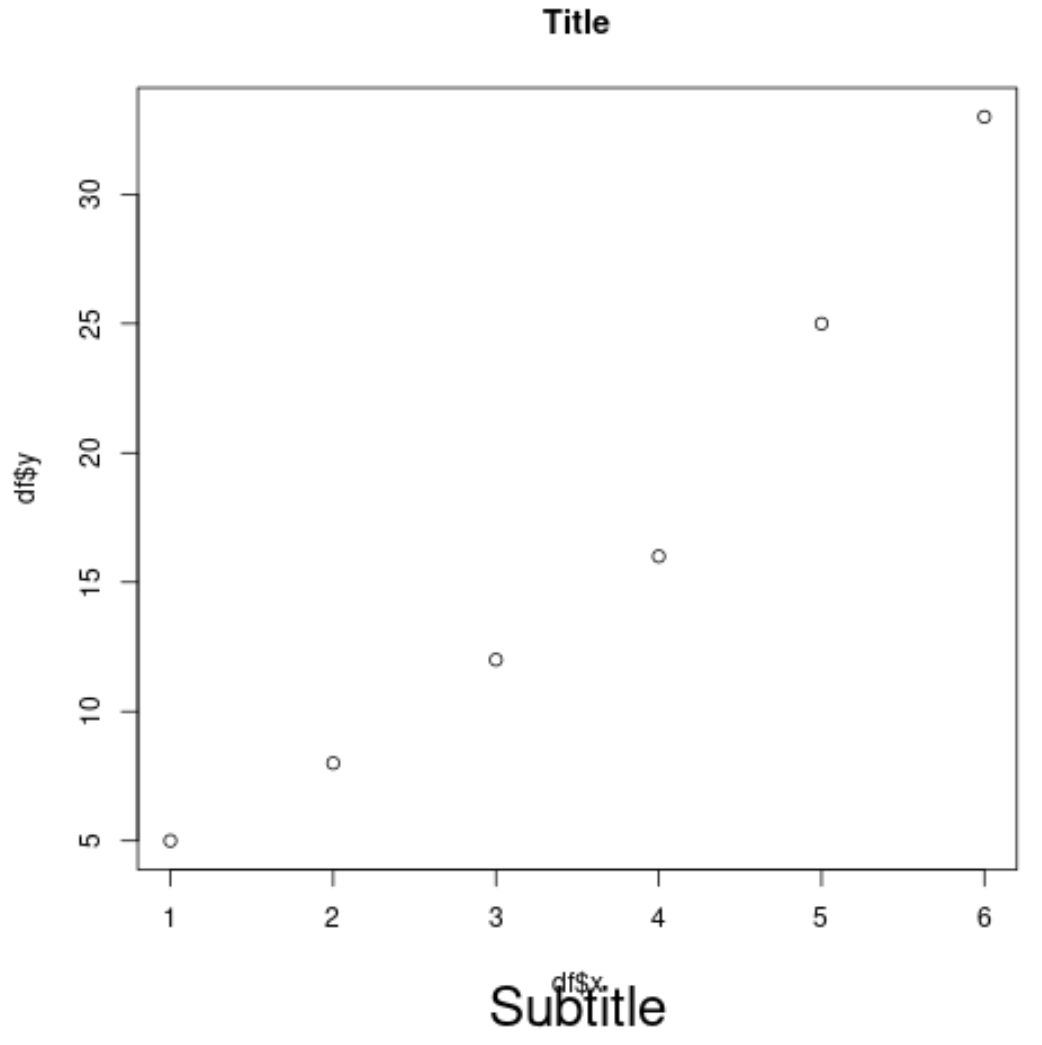
Example 2: Change Font Size of Subtitle
The following code shows how to change the font size of the subtitle of the plot:
#create scatterplot with increased font size of subtitle
plot(df$x, df$y, main='Title', sub='Subtitle'.
     cex.sub=2)
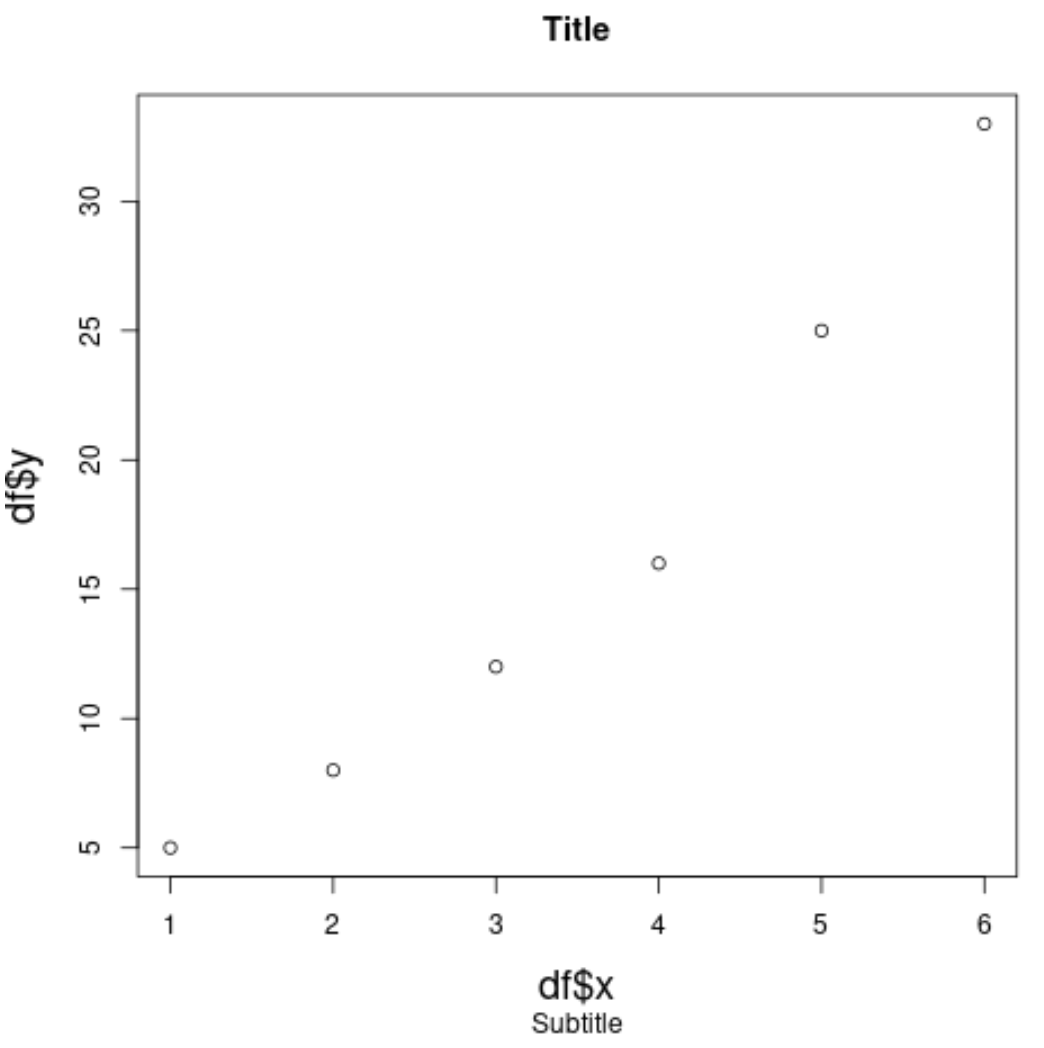
Example 3: Change Font Size of Axis Labels
The following code shows how to change the font size of the axis labels of the plot:
#create scatterplot with increased font size of axis labels
plot(df$x, df$y, main='Title', sub='Subtitle'.
     cex.lab=2)
Example 4: Change Font Size of Axis Text
The following code shows how to change the font size of the axis text of the plot:
#create scatterplot with increased font size of axis text
plot(df$x, df$y, main='Title', sub='Subtitle'.
     cex.axis=2)
Additional Resources
The following tutorials explain how to perform other common plotting operations in R:
How to Add Superscripts & Subscripts to Plots in R
How to Change Font Size in ggplot2 Plots
How to Use Italic Font in R