Quartiles are values that split up a dataset into four equal parts.
You can use the following formula to calculate quartiles for grouped data:
Qi = L + (C/F) * (iN/4 – M)
where:
- L: The lower bound of the interval that contains the ith quartile
- C: The class width
- F: The frequency of the interval that contains the ith quartile
- N: The total frequency
- M: The cumulative frequency leading up to the interval that contains the ith quartile
The following example shows how to use this formula in practice.
Example: Calculate Quartiles for Grouped Data
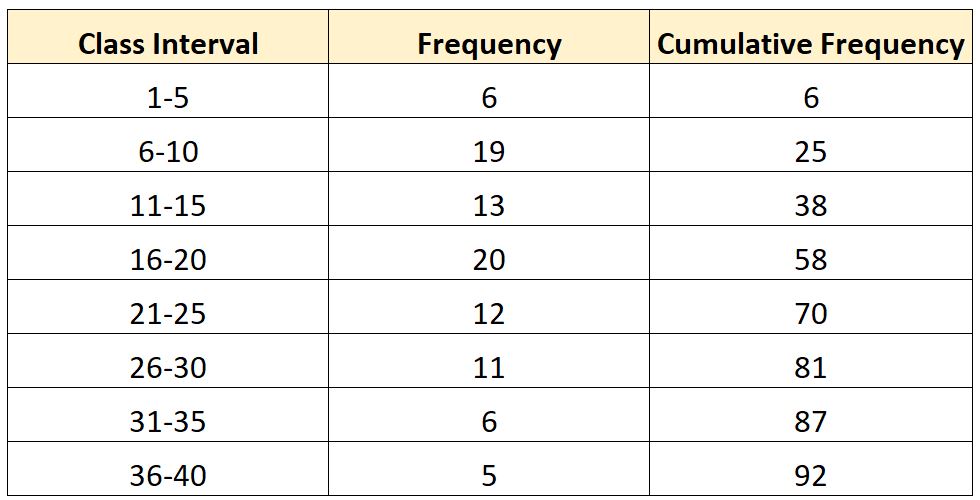
Suppose we have the following frequency distribution:
Now suppose we’d like to calculate the value at the third quartile (Q3) of this distribution.
The value at the third quartile will be located at position (iN/4) in the distribution.
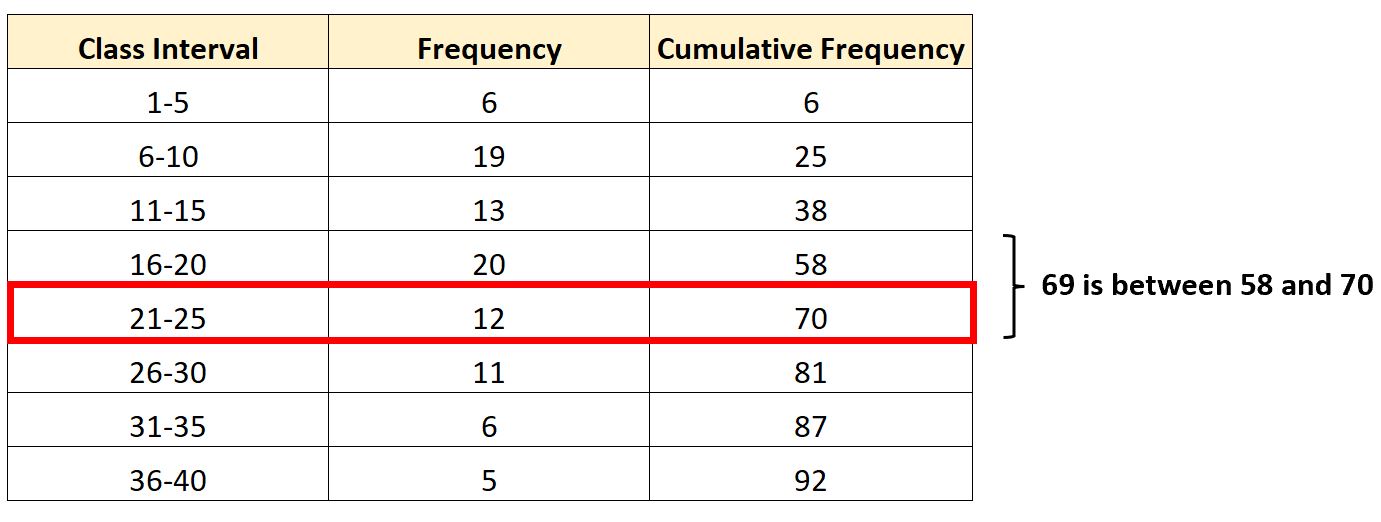
Thus, (iN/4) = (3*92/4) = 69.
The interval that contains the third quartile will be the 21-25 interval since 69 is between the cumulative frequencies of 58 and 70.
Knowing this, we can find each of the values necessary to plug into our formula:
L: The lower bound of the interval that contains the ith quartile
- The lower bound of the interval is 21.
C: The class width
- The class width is calculated as 25 – 21 = 4.
F: The frequency of the interval that contains the ith quartile
- The frequency of the 21-25 class is 12
N: The total frequency
- The total cumulative frequency in the table is 92.
M: The cumulative frequency leading up to the interval that contains the ith quartile
- The cumulative frequency leading up to the 21-25 class is 58.
We can then plug in all of these values into the formula from earlier to find the value at the third quartile:
- Qi = L + (C/F) * (iN/4 – M)
- Q3 = 21 + (4/12) * ((3)(92)/4 – 58)
- Q3 = 24.67
The value at the third quartile is 24.67.
You can use a similar approach to calculate the values for the first and second quartiles.
Additional Resources
The following tutorials provide additional information for working with grouped data:
How to Find Mean & Standard Deviation of Grouped Data
How to Find the Mode of Grouped Data
How to Find the Median of Grouped Data
Grouped vs. Ungrouped Frequency Distributions


