Linear regression is a method we can use to understand the relationship between one or more predictor variables and a response variable.
Typically when we perform linear regression, we’re interested in estimating the mean value of the response variable.
However, we could instead use a method known as quantile regression to estimate any percentile value of the response value such as the 30th percentile, 90th percentile, 98th percentile, etc.
To perform quantile regression in SAS we can use the proc quantreg statement.
The following example shows how to perform quantile regression in SAS in practice.
Example: Performing Quantile Regression in SAS
Suppose we have the following dataset in SAS that shows the number of hours studied and corresponding exam score for students in some class:
/*create dataset*/
data original_data;
    input hours score;
    datalines;
1 75
1 79
2 78
2 83
2 85
3 84
3 84
3 89
4 93
4 88
4 79
4 94
5 96
5 98
;
run;

/*view dataset*/
proc print data=original_data;
Next, we’ll fit a quantile regression model using hours studied as the predictor variable and exam score as the response variable.
We’ll use the model to predict the expected 90th percentile of exam scores based on the number of hours studied:
/*perform quantile regression*/
proc quantreg data=original_data;
    model score = hours / quantile = 0.9;
run;
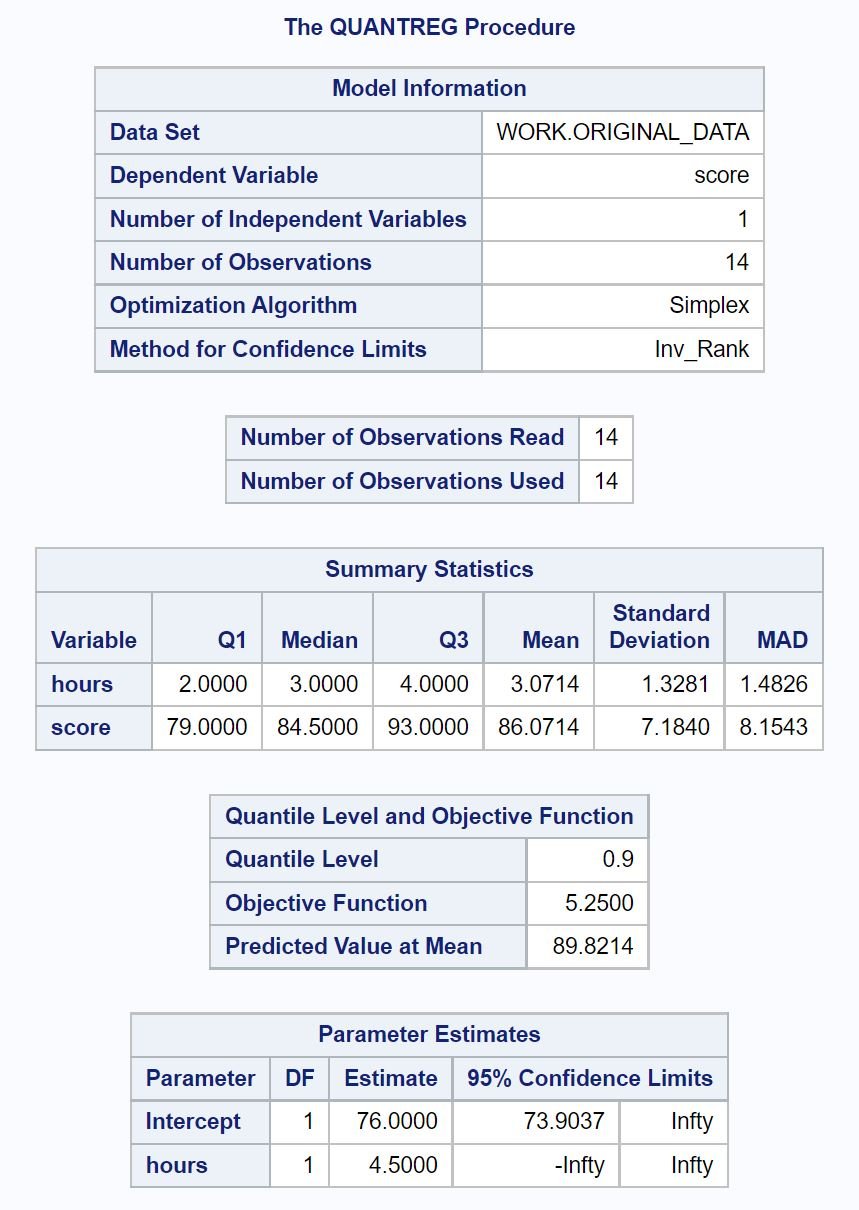
From the output, we can see the estimated regression equation:
90th percentile of exam score = 76 + 4.5(hours)
For example, the 90th percentile of scores for all students who study 2 hours is expected to be 85:
90th percentile of exam score = 76 + 4.5*(2) = 85.
The output also displays a scatter plot of the raw data with the fitted regression line overlaid on the plot:
Unlike a typical regression model, the fitted line for this regression model goes through the 90th percentile of each value of the predictor variable instead of the mean value.
Additional Resources
The following tutorials explain how to perform other common tasks in R:
How to Perform Simple Linear Regression in R
How to Perform Multiple Linear Regression in R
How to Perform Quadratic Regression in R


