To resample time series data means to summarize or aggregate the data by a new time period.
We can use the following basic syntax to resample time series data in Python:
#find sum of values in column1 by month
weekly_df['column1'] = df['column1'].resample('M').sum()

#find mean of values in column1 by week
weekly_df['column1'] = df['column1'].resample('W').mean()
Note that we can resample the time series data by various time periods, including:
- S: Seconds
- min: Minutes
- H: Hours
- D: Day
- W: Week
- M: Month
- Q: Quarter
- A: Year
The following example shows how to resample time series data in practice.
Example: Resample Time Series Data in Python
Suppose we have the following pandas DataFrame that shows the total sales made each hour by some company during a one-year period:
import pandas as pd
import numpy as np

#make this example reproducible
np.random.seed(0)

#create DataFrame with hourly index
df = pd.DataFrame(index=pd.date_range('2020-01-06', '2020-12-27', freq='h'))

#add column to show sales by hour
df['sales'] = np.random.randint(low=0, high=20, size=len(df.index))

#view first five rows of DataFrame
df.head()

	             sales
2020-01-06 00:00:00	12
2020-01-06 01:00:00	15
2020-01-06 02:00:00	0
2020-01-06 03:00:00	3
2020-01-06 04:00:00	3
If we create a line plot to visualize the sales data, it would look like this:
import matplotlib.pyplot as plt

#plot time series data
plt.plot(df.index, df.sales, linewidth=3)
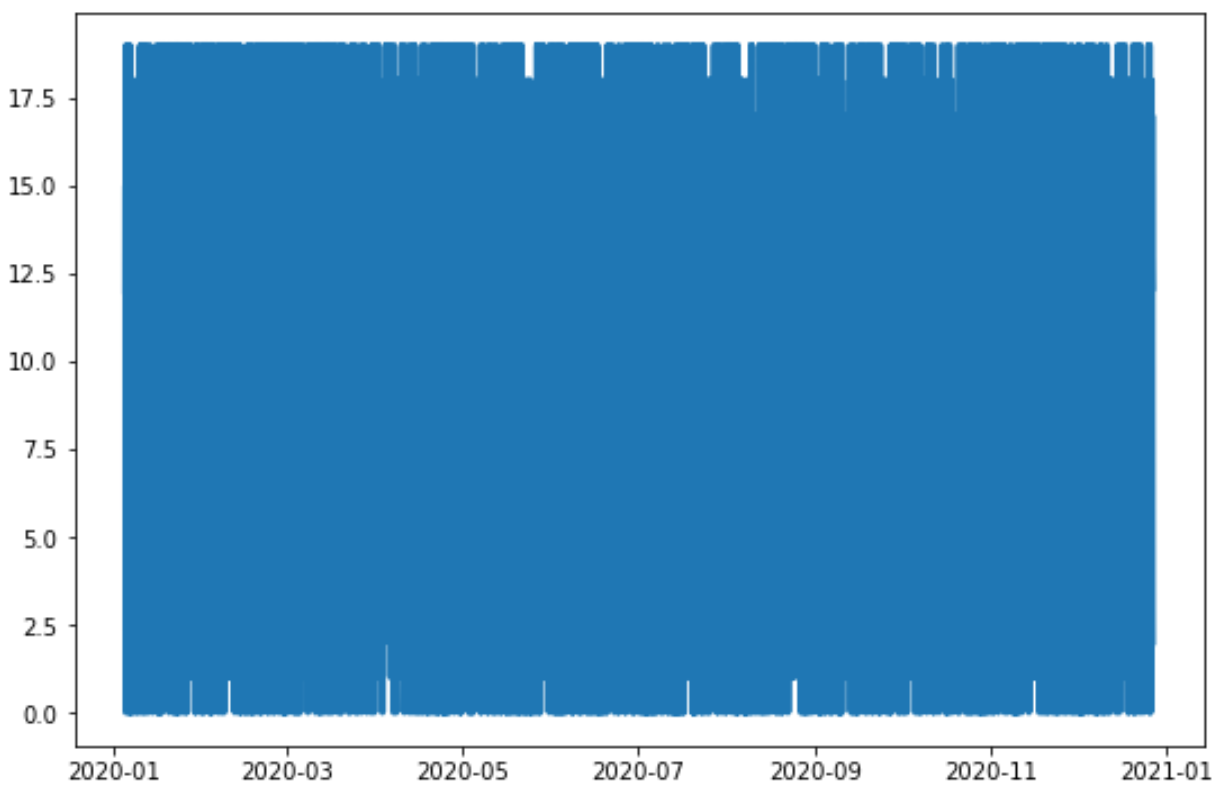
This plot is difficult to interpret, so we may instead summarize the sales data by week:
#create new DataFrame
weekly_df = pd.DataFrame()

#create 'sales' column that summarizes total sales by week
weekly_df['sales'] = df['sales'].resample('W').sum()

#view first five rows of DataFrame
weekly_df.head()

                sales
2020-01-12	1519
2020-01-19	1589
2020-01-26	1540
2020-02-02	1562
2020-02-09	1614
This new DataFrame shows the sum of sales by week.
We can then create a time series plot using this weekly data:
import matplotlib.pyplot as plt

#plot weekly sales data
plt.plot(weekly_df.index, weekly_df.sales, linewidth=3)
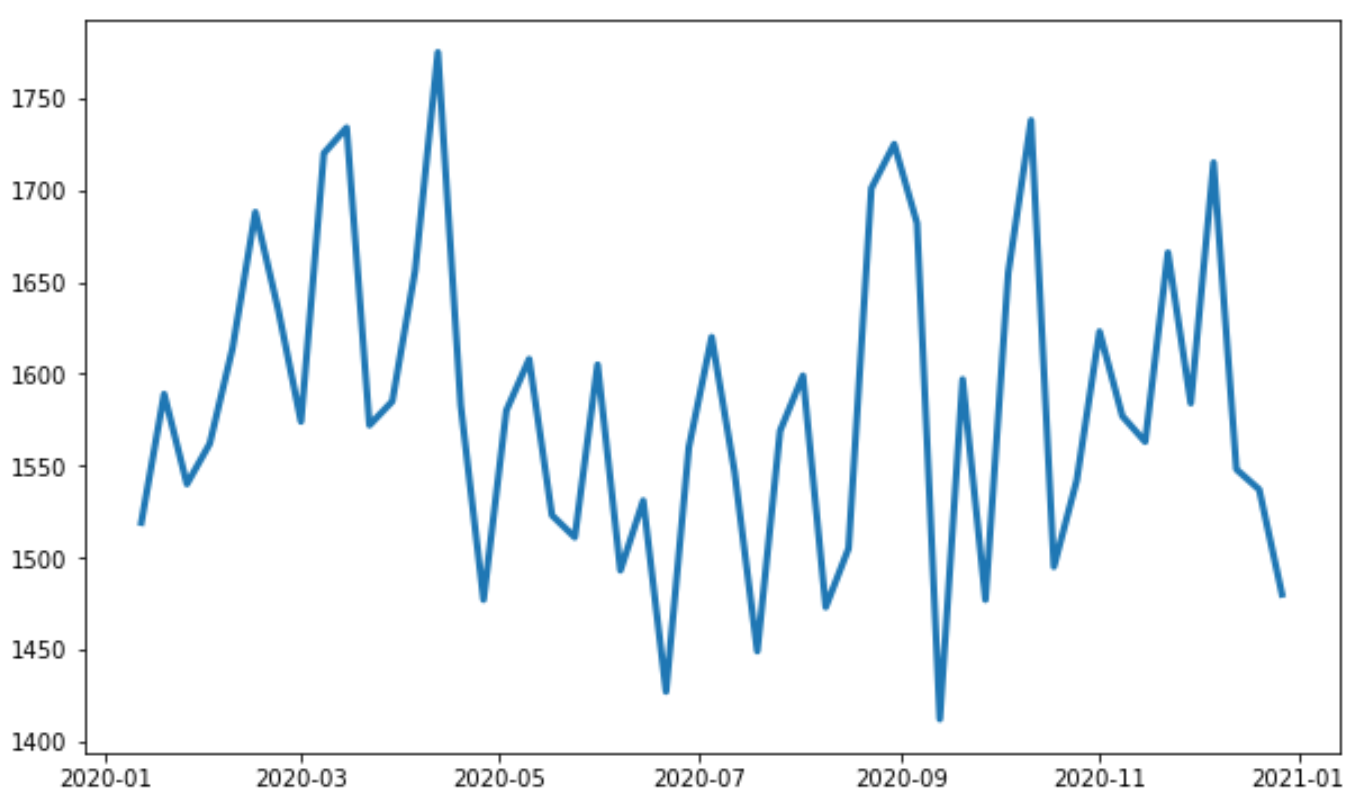
This plot is much easier to read because we only plot sales data for 51 individual weeks as opposed to sales data for 8,545 individual hours in the first example.
Note: In this example, we summarized the sales data by week but we could also summarize by month or quarter if we would like to plot even fewer data points.
Additional Resources
The following tutorials explain how to perform other common operations in Python:
How to Plot a Time Series in Matplotlib
How to Plot a Time Series in Seaborn
How to Calculate MAPE of Time Series in Python