You can use proc summary in SAS to quickly calculate the following descriptive statistics for one or more variables in a dataset:
- N: The total number of observations
- MIN: The minimum value
- MAX: The maximum value
- MEAN: The mean
- STD: The standard deviation
The following examples show how to use this procedure with the SAS built-in dataset called Fish, which contains various measurements for 159 different fish caught in a lake in Finland.
We can use proc print to view the first 10 observations from this dataset:
/*view first 10 observations from Fish dataset*/
proc print data=sashelp.Fish (obs=10);

run;
Related: How to Identify Outliers in SAS
Example 1: Proc Summary with One Variable
We can use the following code to calculate descriptive statistics for the Weight variable:
/*calculate descriptive statistics for Weight variable*/
proc summary data=sashelp.Fish;
   var Weight;
   output out=summaryWeight;
run;

/*print output dataset*/
proc print data=summaryWeight;
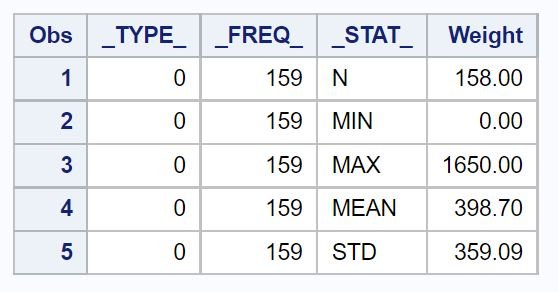
Here’s how to interpret the output table:
- _TYPE_: This column shows whether or not every row in the dataset was used to calculate the descriptive statistics. 0 = Every row was used.
- _FREQ_: The number of rows used to calculate each descriptive statistic.
- _STAT_: The name of the descriptive statistic.
- Weight: The numerical value for the corresponding descriptive statistic.
From the output we can see:
- The total number of observations was 158.
- The minimum weight value was 0.
- The maximum weight value was 1,650.
- The mean weight value was 398.70.
- The standard deviation of weight values was 359.09.
From these five values we can gain a pretty good understanding of the distribution of values for the Weight variable.
Example 2: Proc Summary with Multiple Variables
To calculate descriptive statistics for multiple variables at once, simply list several variable names in the var statement.
For example, we can use the following code to calculate descriptive statistics for the Weight and Height variables:
/*calculate descriptive statistics for Weight and Height variables*/
proc summary data=sashelp.Fish;
   var Weight Height;
   output out=summaryWeightHeight;
run;

/*print output dataset*/
proc print data=summaryWeightHeight;
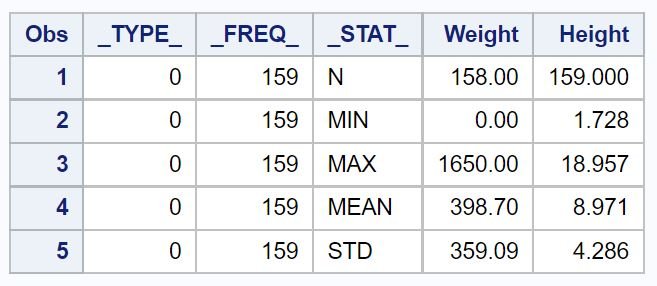
From the output we can see the five descriptive statistics for both Weight and Height.
Example 3: Proc Summary with One Variable Grouped by Another Variable
To calculate descriptive statistics for one variable grouped by another variable, we can use the class statement.
For example, we can use the following code to calculate descriptive statistics for Weight grouped by Species:
/*calculate descriptive statistics for Weight grouped by Species*/
proc summary data=sashelp.Fish;
   var Weight;
   class Species;
   output out=summaryWeightSpecies;
run;

/*print output dataset*/
proc print data=summaryWeightSpecies;
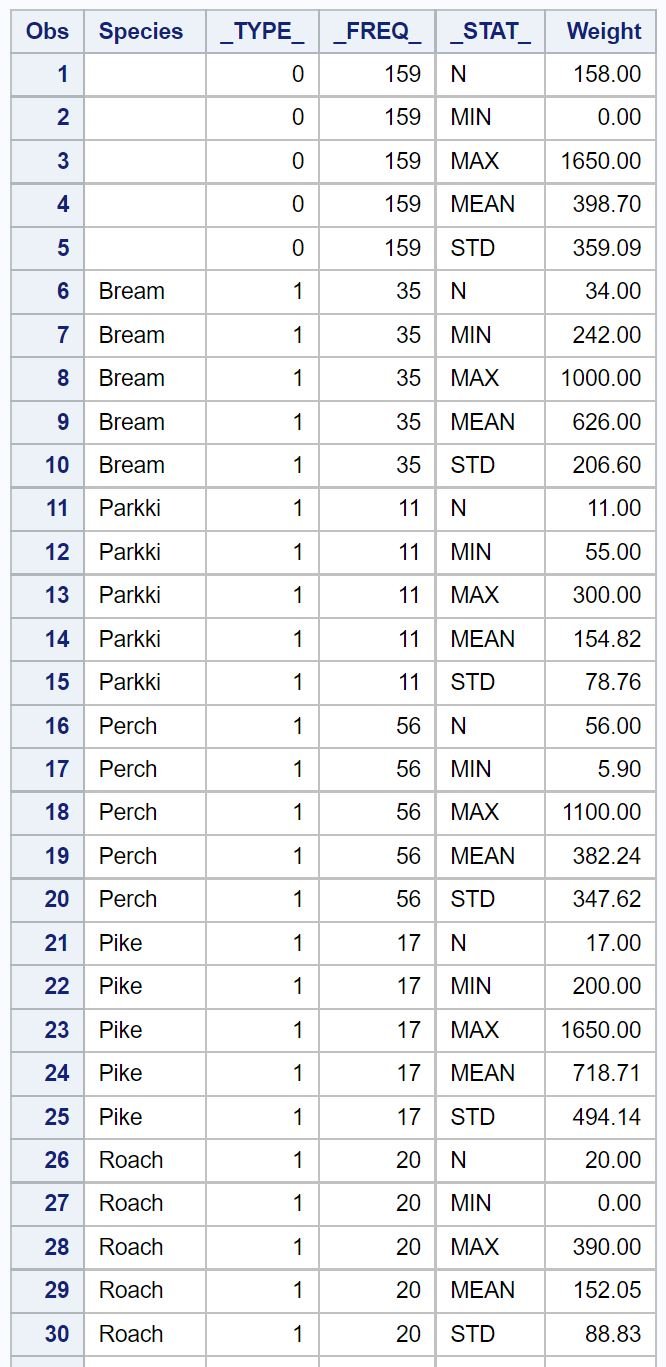
The output table displays the descriptive statistics for each Species of fish.
For example, we can observe the following descriptive statistics for just the Bream fish:
- The total number of observations was 34.
- The minimum weight value was 242.
- The maximum weight value was 1,000.
- The mean weight value was 626.
- The standard deviation of weight values was 206.60.
We can observe these descriptive statistics for every other species as well.
Additional Resources
The following tutorials explain how to perform other common tasks in SAS:
How to Use Proc Append in SAS
How to Use Proc Tabulate in SAS
How to Calculate Correlation in SAS
How to Create Frequency Tables in SAS


