Probability describes the likelihood that some event occurs.
We can calculate probabilities in Excel by using the PROB function, which uses the following syntax:
PROB(x_range, prob_range, lower_limit, [upper_limit])
where:
- x_range: The range of numeric x values.
- prob_range: The range of probabilities associated with each x value.
- lower_limit: The lower limit on the value for which you want a probability.
- upper_limit: The upper limit on the value for which you want a probability. Optional.
This tutorial provides several examples of how to use this function in practice.
Example 1: Dice Probabilities
The following image shows the probability of a dice landing on a certain value on a given roll:
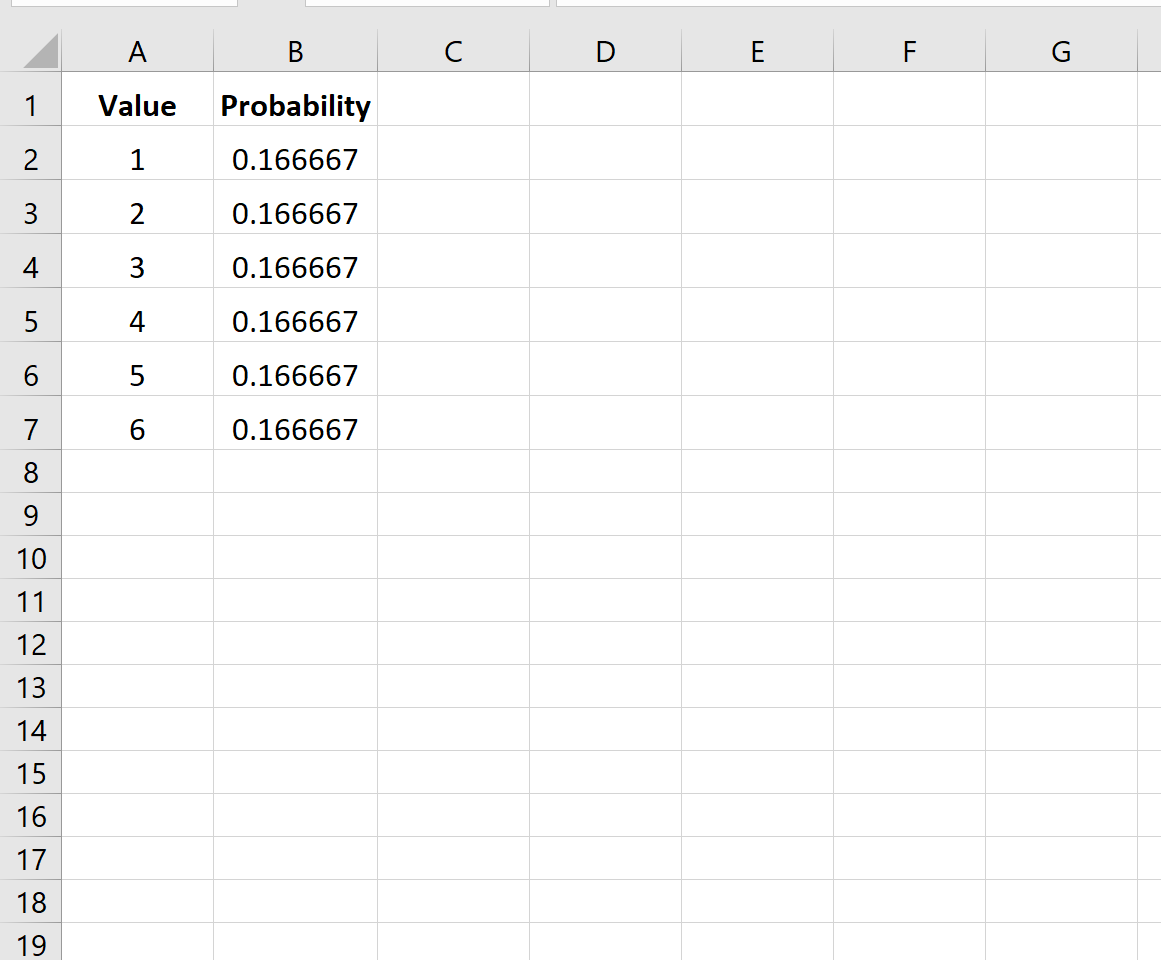
Since the dice is equally likely to land on each value, the probability is the same for each value.
The following image shows how to find the probability that the dice lands on a number between 3 and 6:
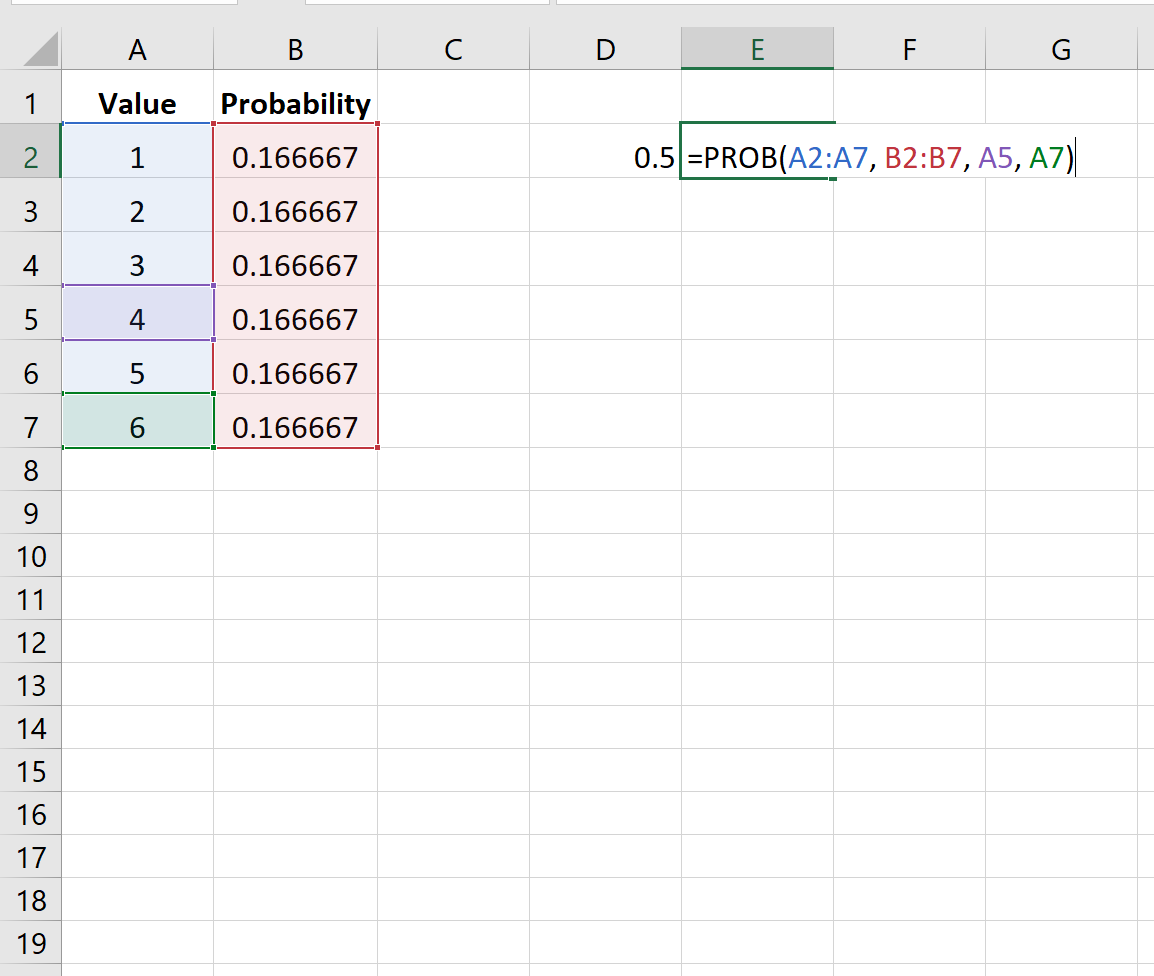
The probability turns out to be 0.5.
Note that the upper limit argument is optional. So, we could use the following syntax to find the probability that the dice lands on just 4:
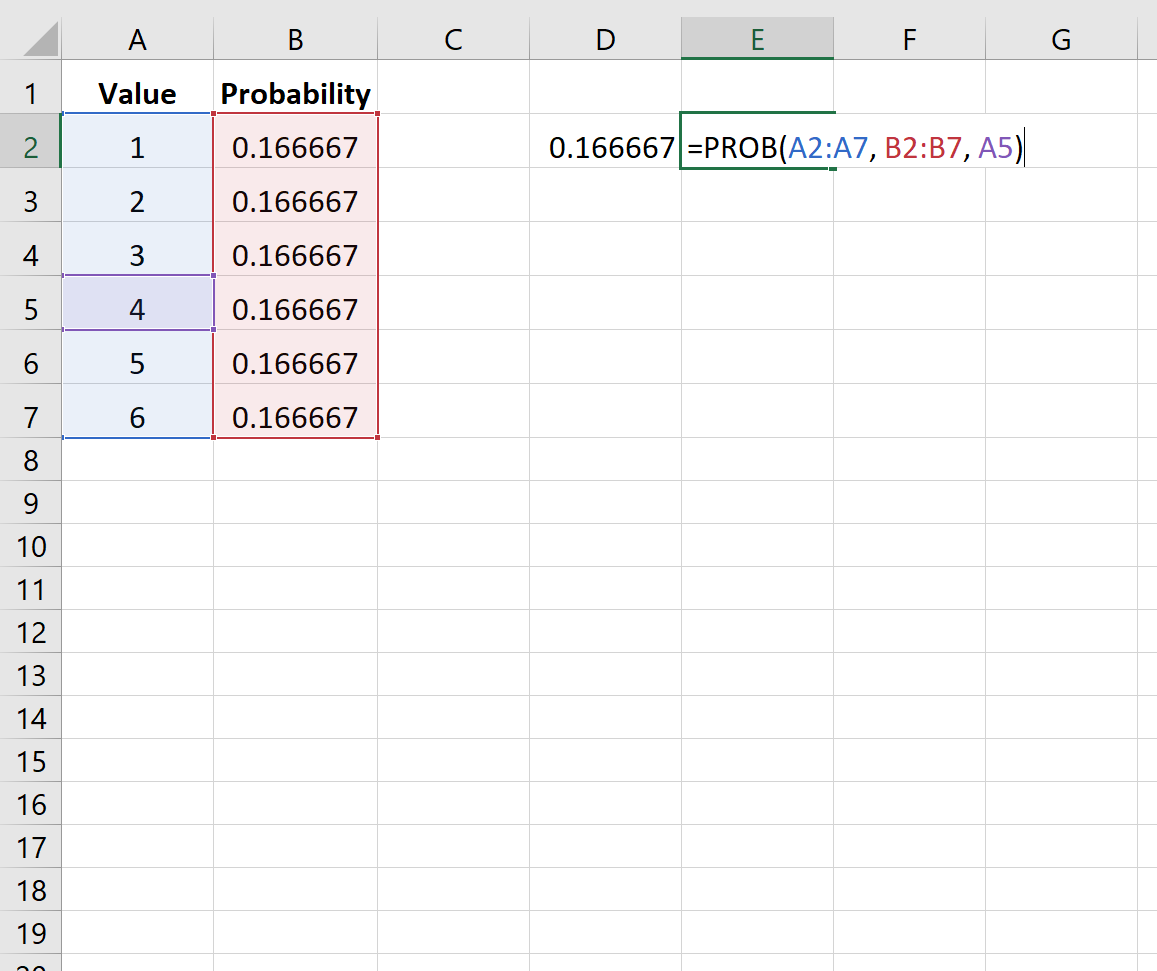
The probability turns out to be 0.166667.
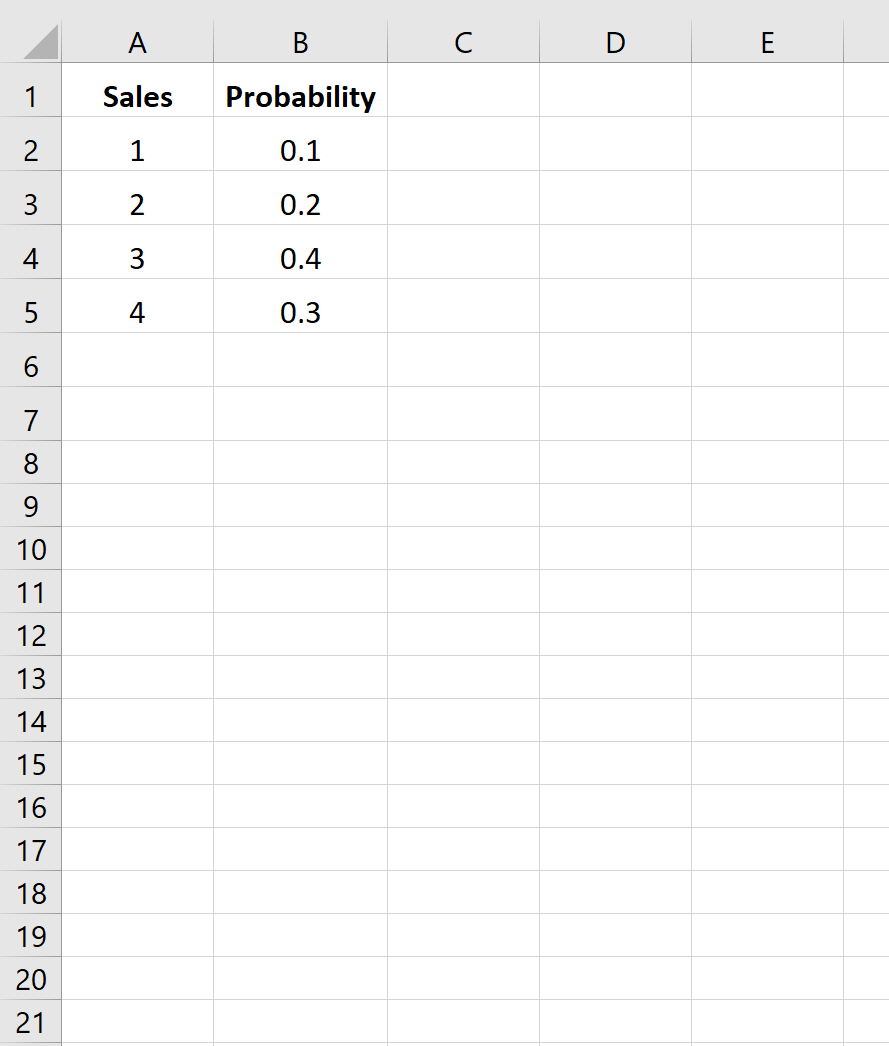
Example 2: Sales Probabilities
The following image shows the probability of a company selling a certain number of products in the upcoming quarter:
The following image shows how to find the probability that the company makes either 3 or 4 sales:
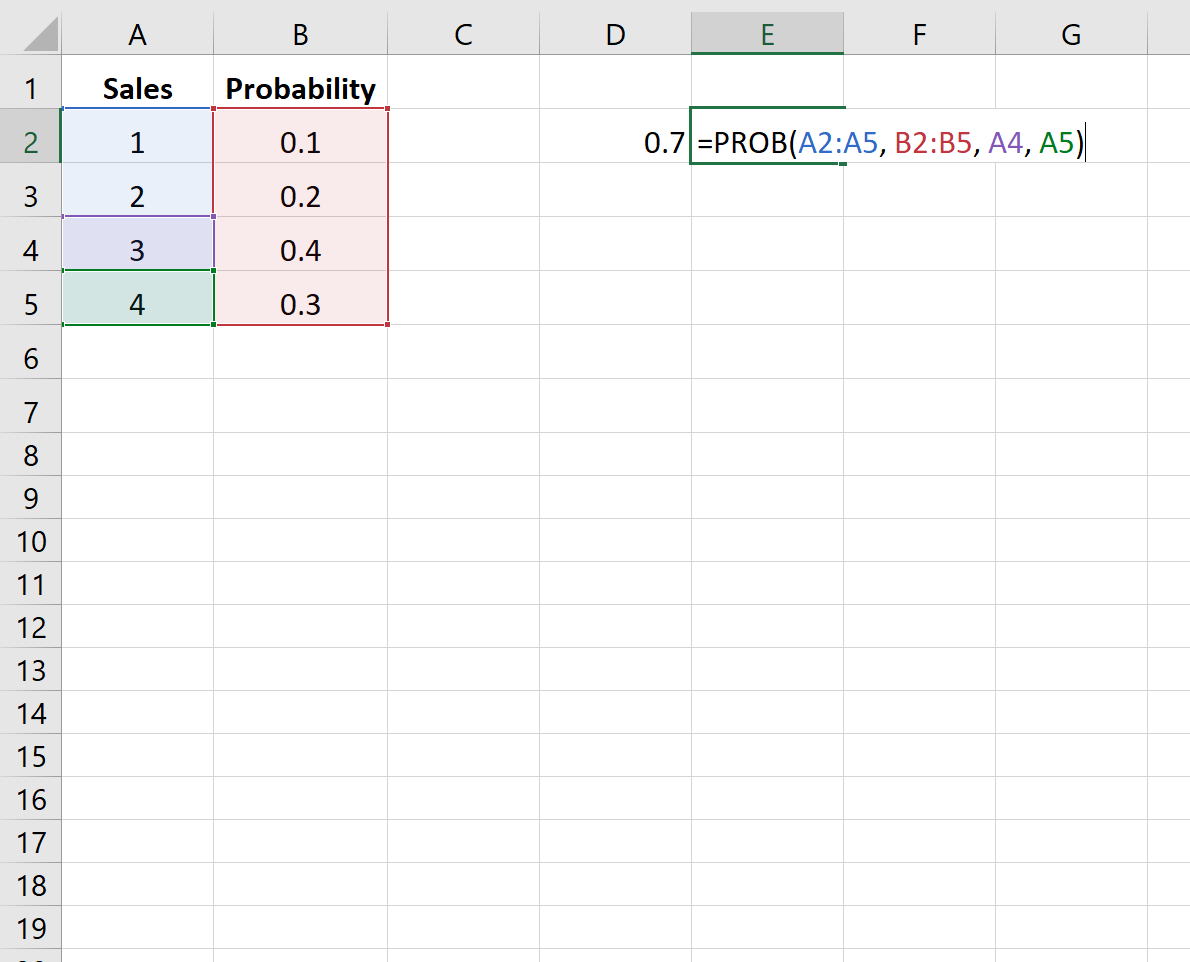
The probability turns out to be 0.7.
Additional Resources
How to Calculate Relative Frequency in Excel
How to Calculate Cumulative Frequency in Excel
How to Create a Frequency Distribution in Excel