One way to visualize the performance of classification models in machine learning is by creating a ROC curve, which stands for “receiver operating characteristic” curve.
Often you may want to fit several classification models to one dataset and create a ROC curve for each model to visualize which model performs best on the data.
The following step-by-step example shows how plot multiple ROC curves in Python.
Step 1: Import Necessary Packages
First, we’ll import several necessary packages in Python:
from sklearn import metrics
from sklearn import datasets
from sklearn.model_selection import train_test_split
from sklearn.linear_model import LogisticRegression
from sklearn.ensemble import GradientBoostingClassifier
import numpy as np
import matplotlib.pyplot as plt
Step 2: Create Fake Data
Next, we’ll use the make_classification() function from sklearn to create a fake dataset with 1,000 rows, four predictor variables, and one binary response variable:
#create fake dataset
X, y = datasets.make_classification(n_samples=1000,
                                    n_features=4,
                                    n_informative=3,
                                    n_redundant=1,
                                    random_state=0)

#split dataset into training and testing set
X_train, X_test, y_train, y_test = train_test_split(X, y, test_size=.3,random_state=0)
Step 3: Fit Multiple Models & Plot ROC Curves
Next, we’ll fit a logistic regression model and then a gradient boosted model to the data and plot the ROC curve for each model on the same plot:
#set up plotting area
plt.figure(0).clf()

#fit logistic regression model and plot ROC curve
model = LogisticRegression()
model.fit(X_train, y_train)
y_pred = model.predict_proba(X_test)[:, 1]
fpr, tpr, _ = metrics.roc_curve(y_test, y_pred)
auc = round(metrics.roc_auc_score(y_test, y_pred), 4)
plt.plot(fpr,tpr,label="Logistic Regression, AUC="+str(auc))

#fit gradient boosted model and plot ROC curve
model = GradientBoostingClassifier()
model.fit(X_train, y_train)
y_pred = model.predict_proba(X_test)[:, 1]
fpr, tpr, _ = metrics.roc_curve(y_test, y_pred)
auc = round(metrics.roc_auc_score(y_test, y_pred), 4)
plt.plot(fpr,tpr,label="Gradient Boosting, AUC="+str(auc))

#add legend
plt.legend()
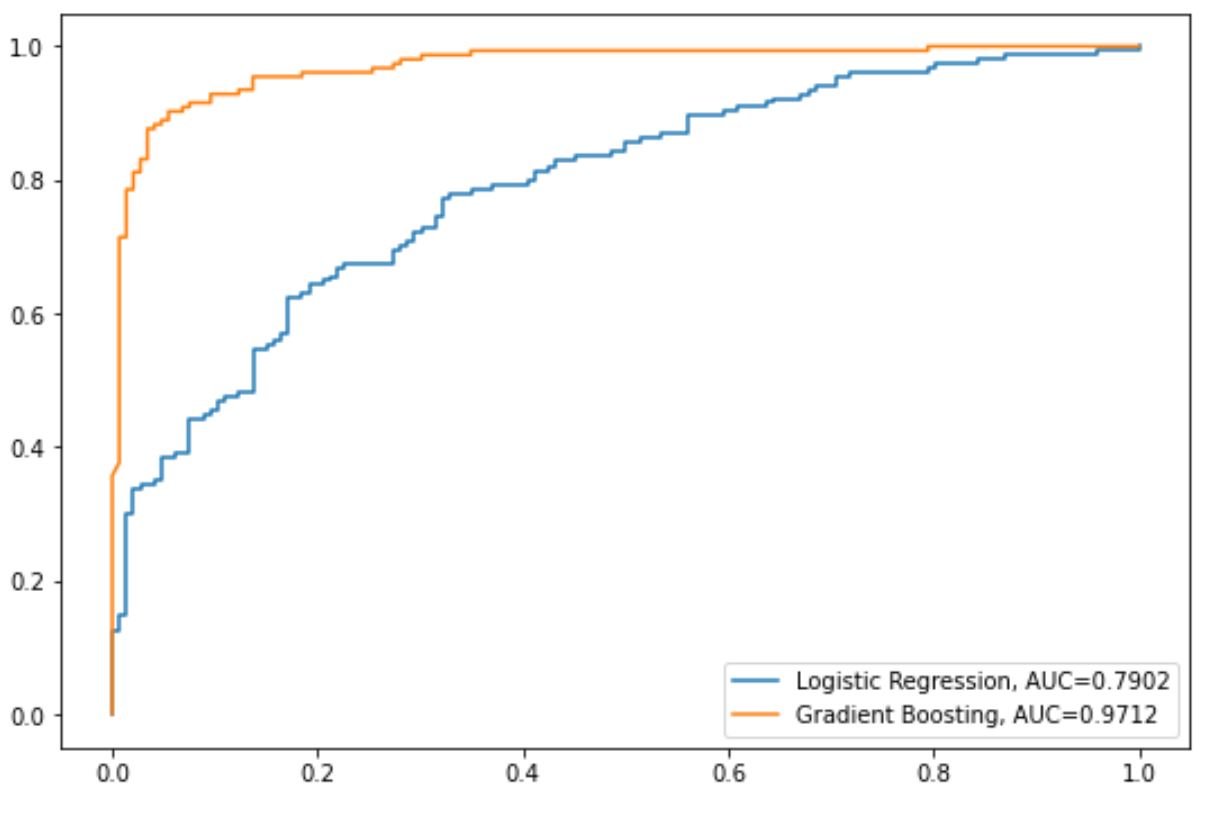
The blue line shows the ROC curve for the logistic regression model and the orange line shows the ROC curve for the gradient boosted model.
The more that a ROC curve hugs the top left corner of the plot, the better the model does at classifying the data into categories.
To quantify this, we can calculate the AUC – area under the curve – which tells us how much of the plot is located under the curve.
The closer AUC is to 1, the better the model.
From our plot we can see the following AUC metrics for each model:
- AUC of logistic regression model: 0.7902
- AUC of gradient boosted model: 0.9712
Clearly the gradient boosted model does a better job of classifying the data into categories compared to the logistic regression model.
Additional Resources
The following tutorials provide additional information about classification models and ROC curves:
Introduction to Logistic Regression
How to Interpret a ROC Curve (With Examples)
What is Considered a Good AUC Score?