Often you may be interested in plotting the curve of a fitted logistic regression model in R.
Fortunately this is fairly easy to do and this tutorial explains how to do so in both base R and ggplot2.
Example: Plot a Logistic Regression Curve in Base R
The following code shows how to fit a logistic regression model using variables from the built-in mtcars dataset in R and then how to plot the logistic regression curve:
#fit logistic regression model
model #define new data frame that contains predictor variable
newdata frame(hp=seq(min(mtcars$hp), max(mtcars$hp),len=500))

#use fitted model to predict values of vs
newdata$vs = predict(model, newdata, type="response")

#plot logistic regression curve
plot(vs ~ hp, data=mtcars, col="steelblue")
lines(vs ~ hp, newdata, lwd=2)
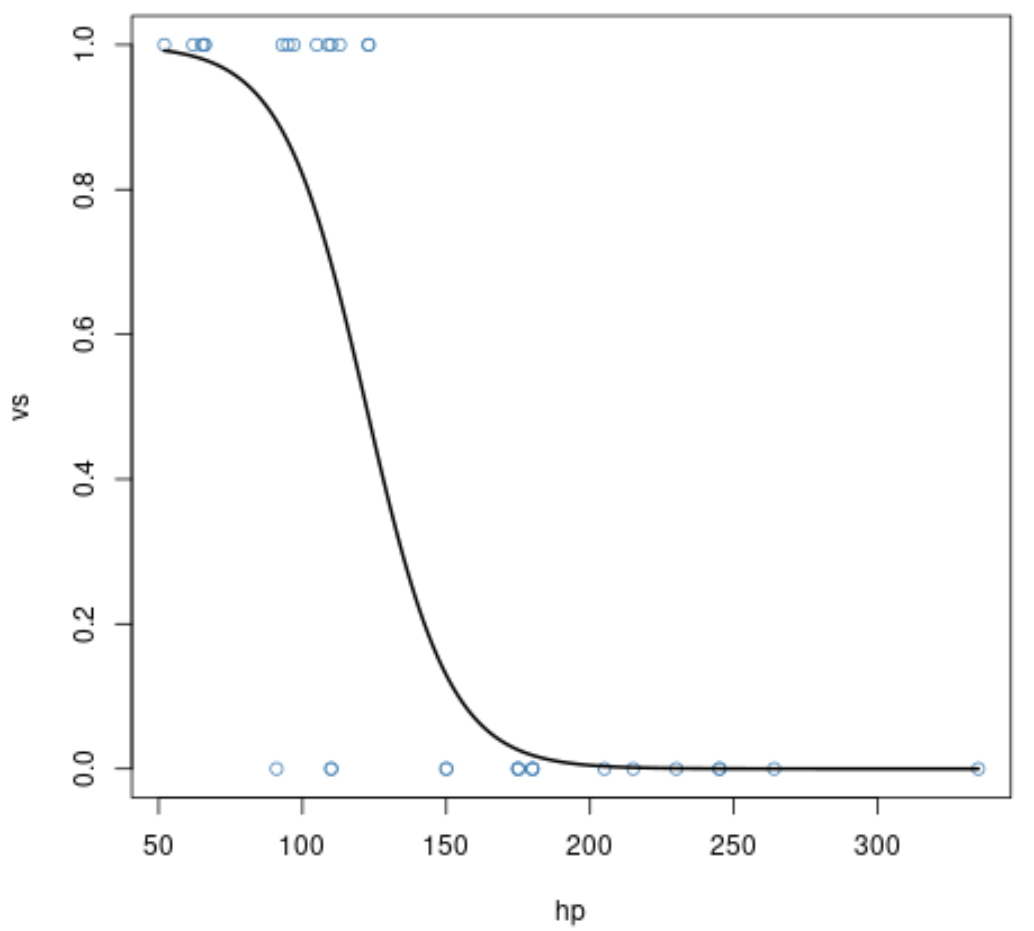
The x-axis displays the values of the predictor variable hp and the y-axis displays the predicted probability of the response variable am.
We can clearly see that higher values of the predictor variable hp are associated with lower probabilities of the response variable vs being equal to 1.
Example: Plot a Logistic Regression Curve in ggplot2
The following code shows how to fit the same logistic regression model and how to plot the logistic regression curve using the data visualization library ggplot2:
library(ggplot2)

#plot logistic regression curve
ggplot(mtcars, aes(x=hp, y=vs)) +
  geom_point(alpha=.5) +
  stat_smooth(method="glm", se=FALSE, method.args = list(family=binomial))
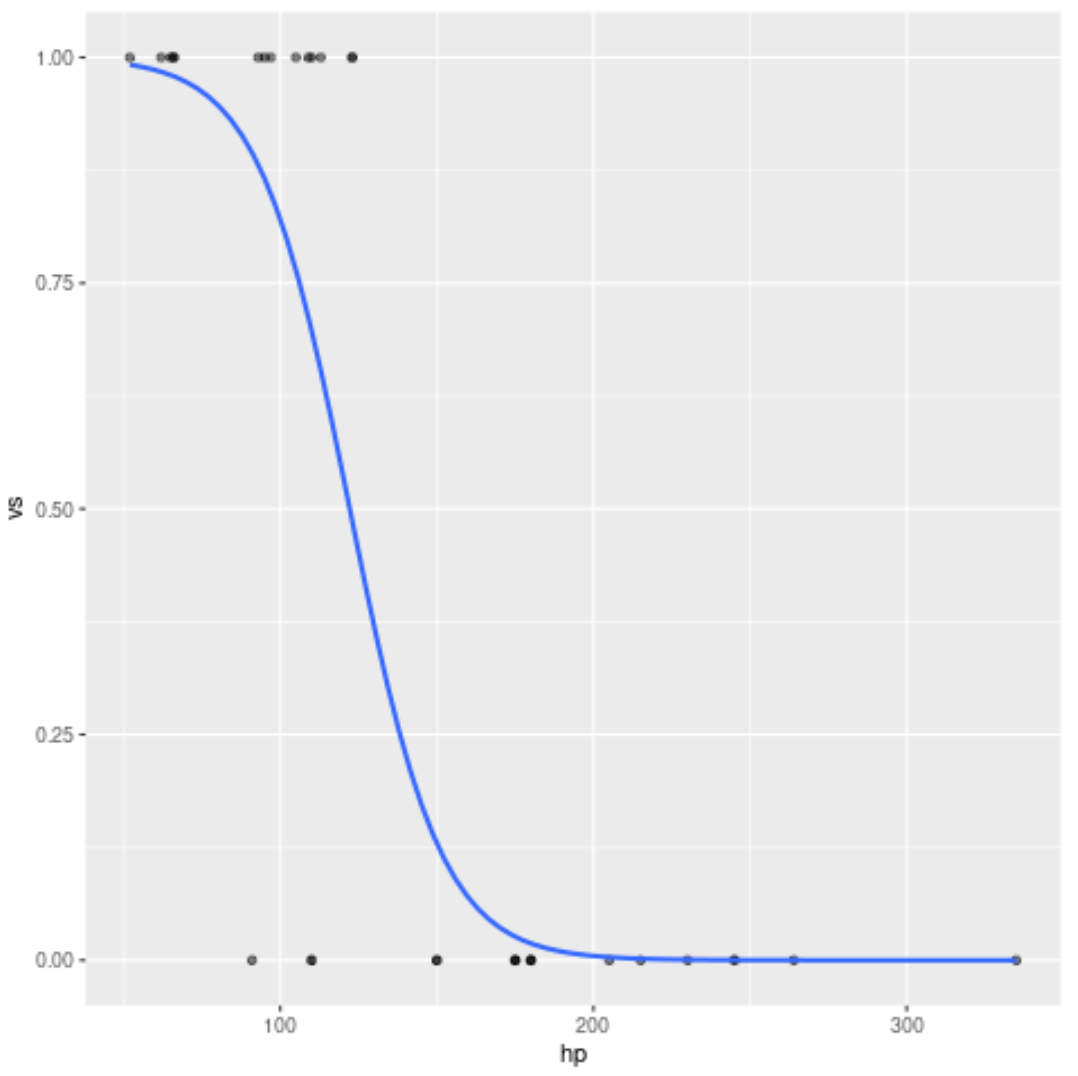
Note that this is the exact same curve produced in the previous example using base R.
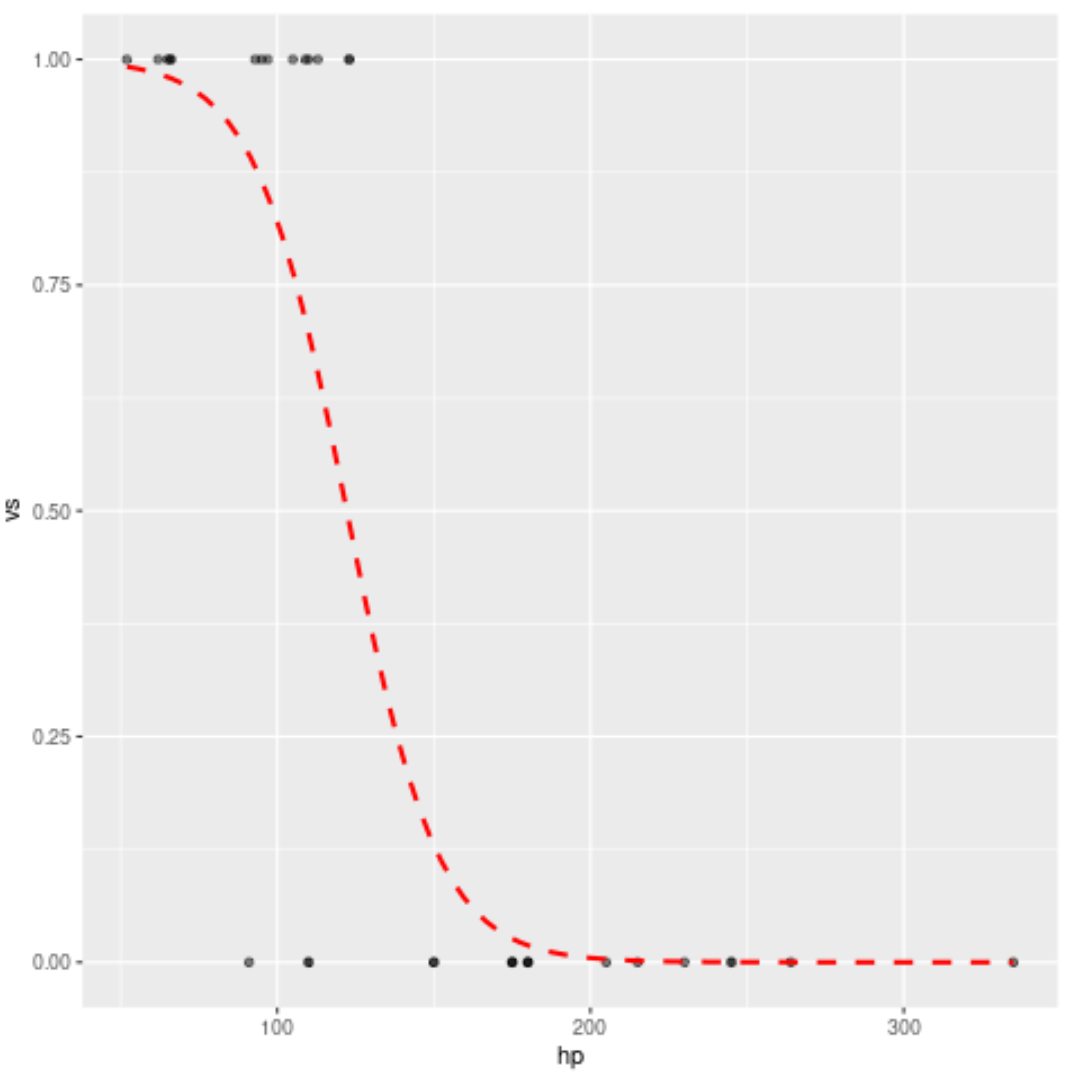
Feel free to modify the style of the curve as well. For example, we could turn the curve into a red dashed line:
library(ggplot2)

#plot logistic regression curve
ggplot(mtcars, aes(x=hp, y=vs)) +
  geom_point(alpha=.5) +
  stat_smooth(method="glm", se=FALSE, method.args = list(family=binomial),
              col="red", lty=2)
Additional Resources
Introduction to Logistic Regression
How to Perform Logistic Regression in R (Step-by-Step)
How to Perform Logistic Regression in Python (Step-by-Step)
How to Use seq Function in R