The exponential distribution is a probability distribution that is used to model the time we must wait until a certain event occurs.
If a random variable X follows an exponential distribution, then the probability density function of X can be written as:
f(x; λ) = λe-λx
where:
- λ: the rate parameter
- e: A constant roughly equal to 2.718
The cumulative distribution function of X can be written as:
F(x; λ) = 1 – e-λx
This tutorial explains how to plot a PDF and CDF for the exponential distribution in R.
Plotting a Probability Density Function
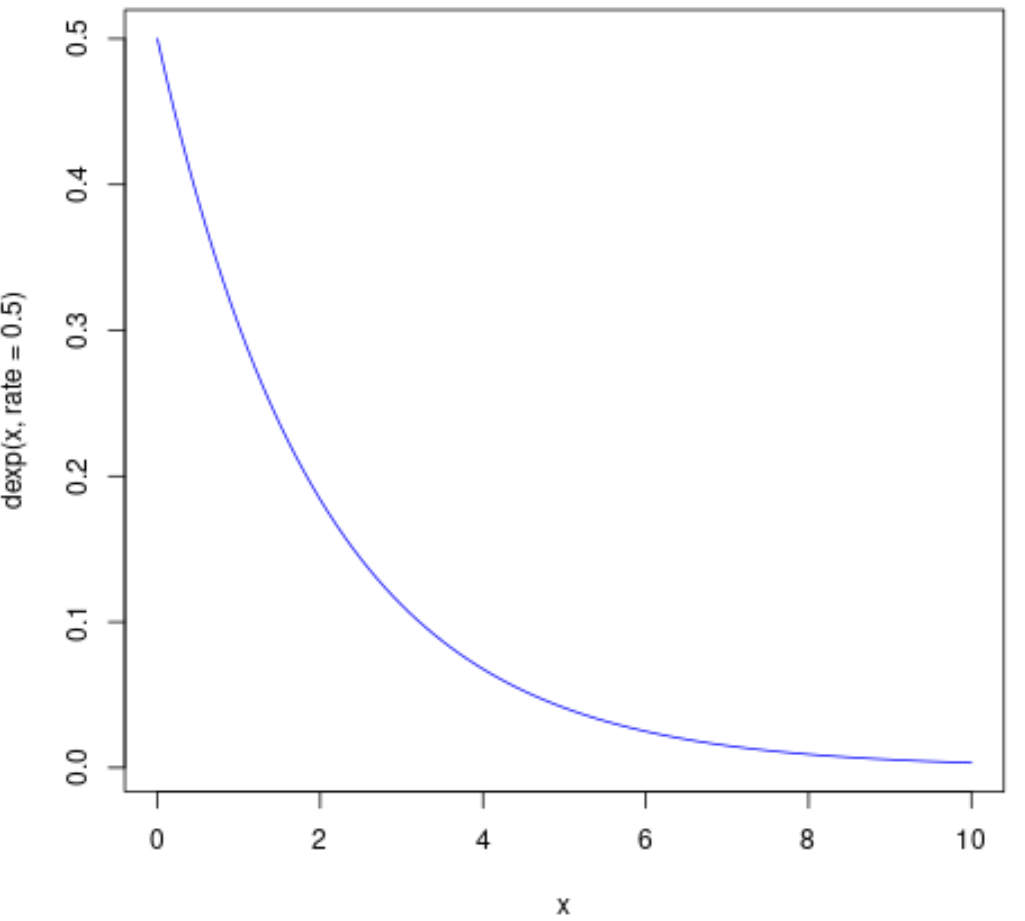
The following code shows how to plot a PDF of an exponential distribution with rate parameter λ = 0.5:
curve(dexp(x, rate = .5), from=0, to=10, col='blue')
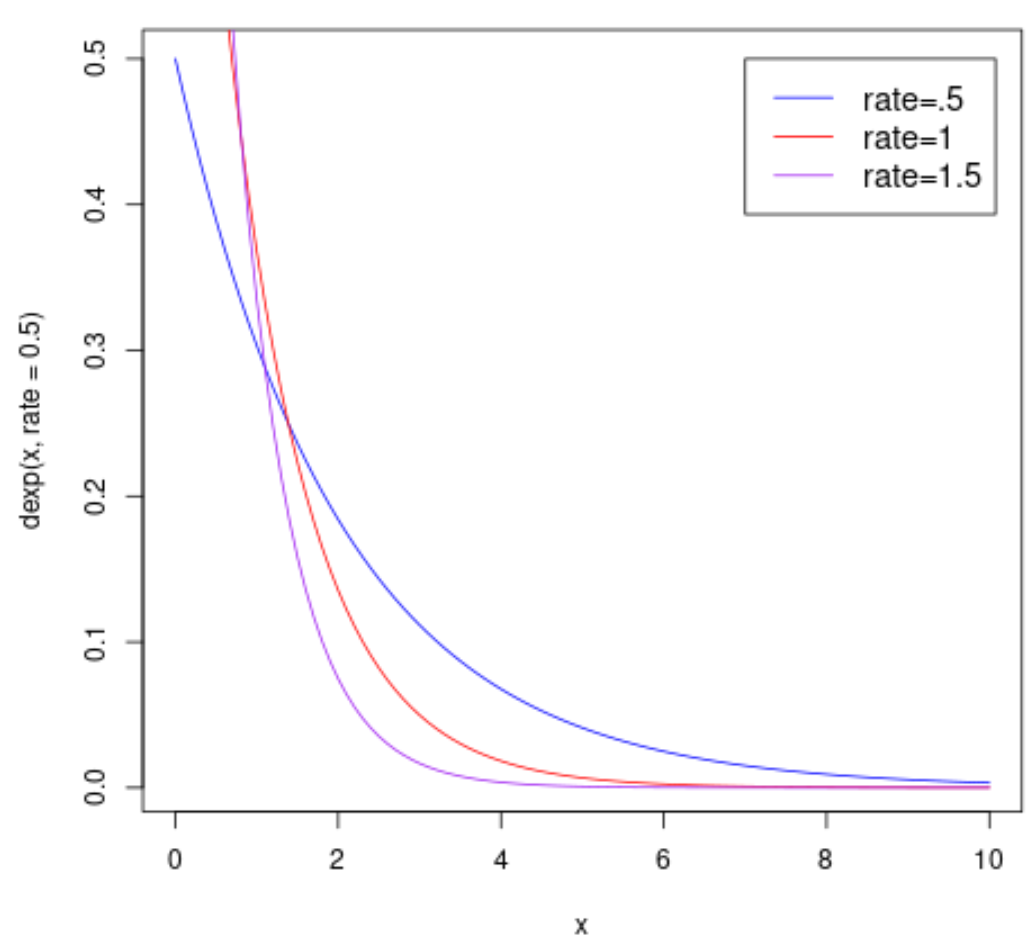
The following code shows how to plot multiple PDF’s of an exponential distribution with various rate parameters:
#plot PDF curves
curve(dexp(x, rate = .5), from=0, to=10, col='blue')
curve(dexp(x, rate = 1), from=0, to=10, col='red', add=TRUE)
curve(dexp(x, rate = 1.5), from=0, to=10, col='purple', add=TRUE)

#add legend
legend(7, .5, legend=c("rate=.5", "rate=1", "rate=1.5"),
       col=c("blue", "red", "purple"), lty=1, cex=1.2)
Plotting a Cumulative Distribution Function
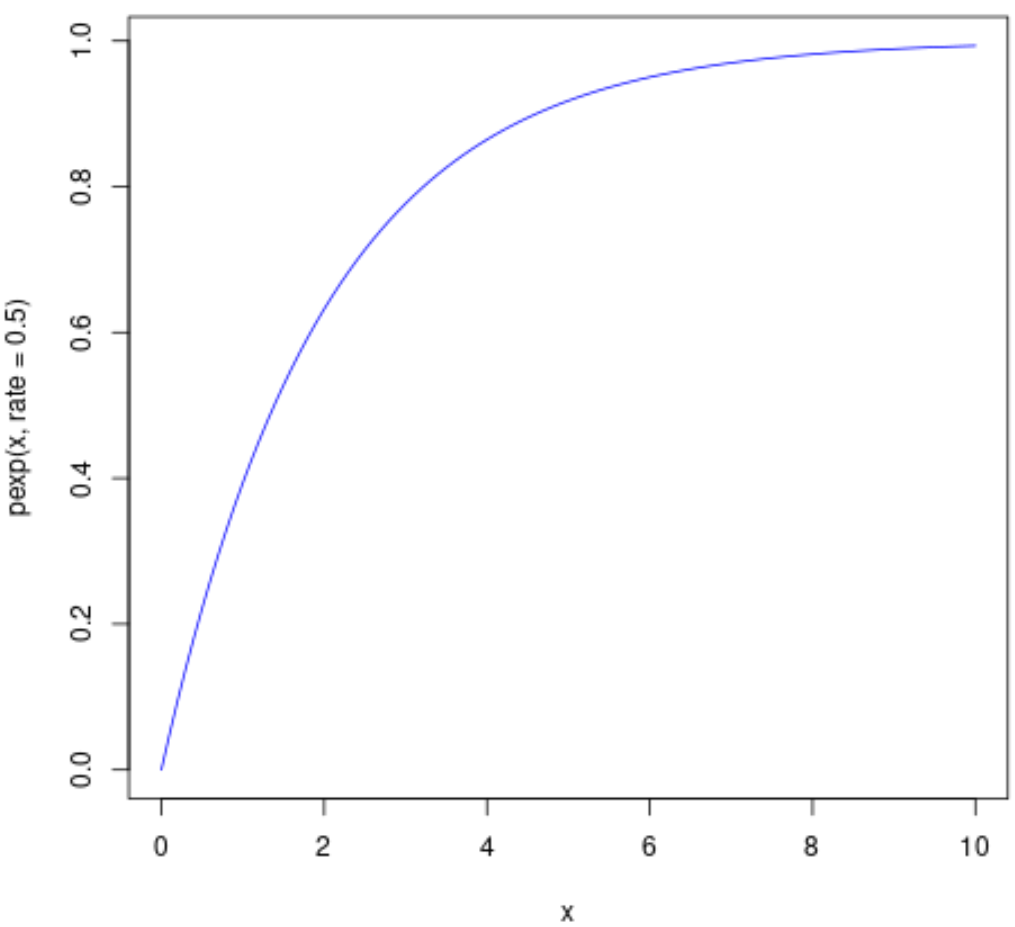
The following code shows how to plot a CDF of an exponential distribution with rate parameter λ = 0.5:
curve(pexp(x, rate = .5), from=0, to=10, col='blue')
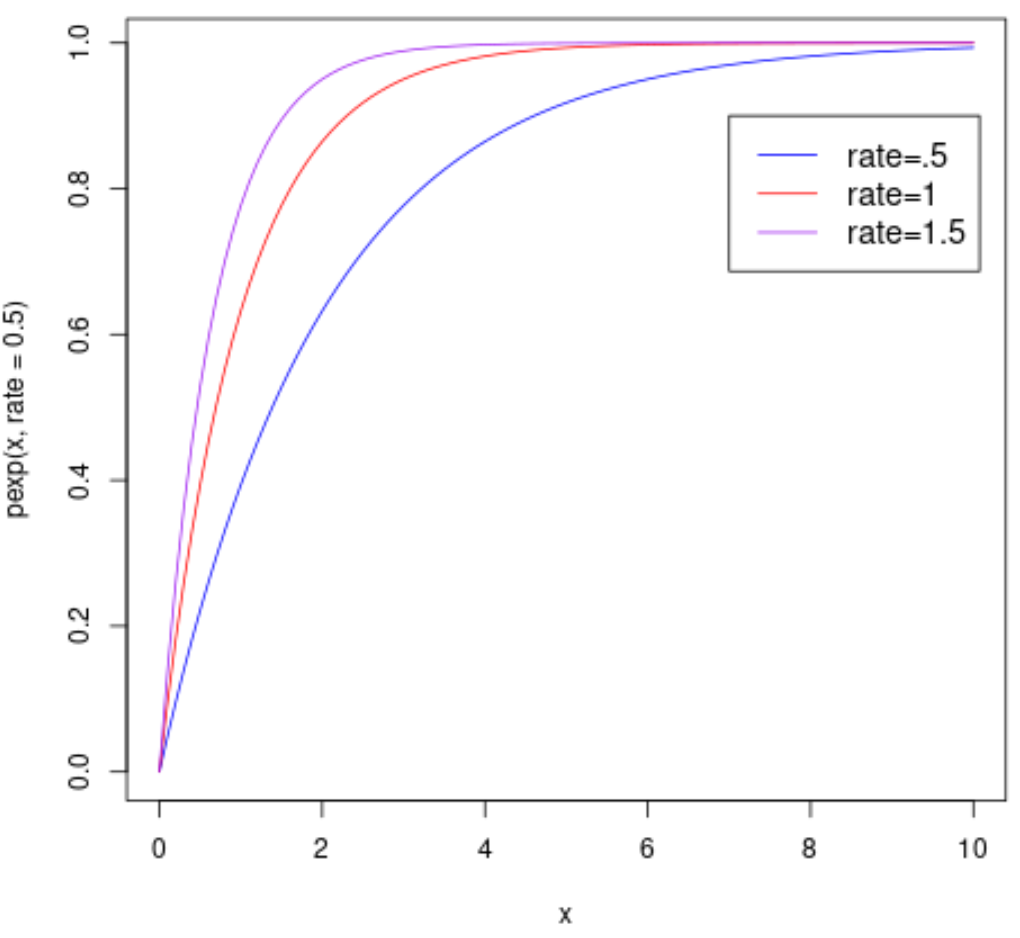
The following code shows how to plot multiple CDF’s of an exponential distribution with various rate parameters:
#plot CDF curves
curve(pexp(x, rate = .5), from=0, to=10, col='blue')
curve(pexp(x, rate = 1), from=0, to=10, col='red', add=TRUE)
curve(pexp(x, rate = 1.5), from=0, to=10, col='purple', add=TRUE)

#add legend
legend(7, .9, legend=c("rate=.5", "rate=1", "rate=1.5"),
       col=c("blue", "red", "purple"), lty=1, cex=1.2)
Additional Resources
The following tutorials explain how to plot other probability distributions in R:
How to Plot a Poisson Distribution in R
How to Plot a Binomial Distribution in R
How to Plot a t Distribution in R
How to Plot a Normal Distribution in R
How to Plot a Chi-Square Distribution in R