You can use the following formula to calculate percentile rank for grouped data:
Percentile Rank = L + (RN/100 – M) / F * C
where:
- L: The lower bound of the interval that contains the percentile rank
- R: The percentile rank
- N: The total frequency
- M: The cumulative frequency leading up to the interval that contains the percentile rank
- F: The frequency of the interval that contains the percentile rank
- C: The class width
The following example shows how to use this formula in practice.
Example: Calculate Percentile Rank for Grouped Data
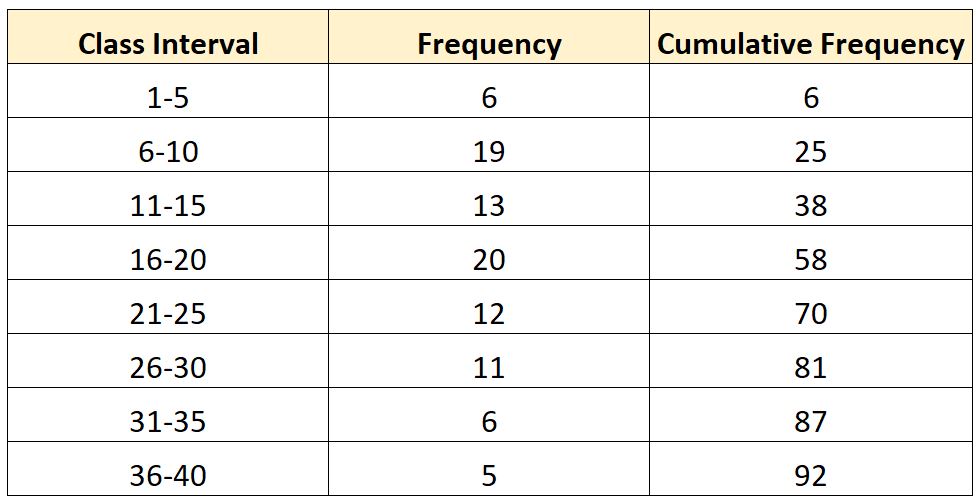
Suppose we have the following frequency distribution:
Now suppose we’d like to calculate the value at the 64th percentile of this distribution.
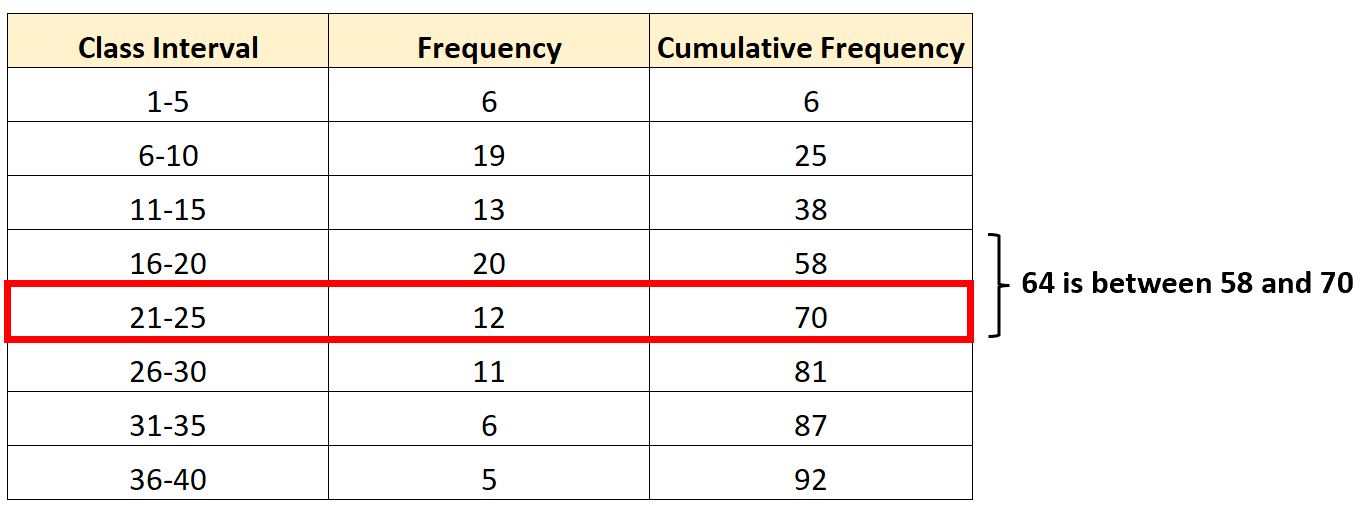
The interval that contains the 64th percentile will be the 21-25 interval since 64 is between the cumulative frequencies of 58 and 70.
Knowing this, we can find each of the values necessary to plug into our formula:
L: The lower bound of the interval that contains the percentile rank
- The lower bound of the interval is 21.
R: The percentile rank
- The percentile we’re interested in is 64.
N: The total frequency
- The total cumulative frequency in the table is 92.
M: The cumulative frequency leading up to the interval that contains the percentile rank
- The cumulative frequency leading up to the 21-25 class is 58.
F: The frequency of the interval that contains the percentile rank
- The frequency of the 21-25 class is 12.
C: The class width
- The class width is calculated as 25 – 21 = 4.
We can then plug in all of these values into the formula from earlier to find the value at the 64th percentile:
- Percentile Rank = L + (RN/100 – M) / F * C
- 64th Percentile Rank = 21 + (64*92/100 – 58) / 12 * 4
- Percentile Rank = 21.293
The value at the 64th percentile is 21.293.
Additional Resources
The following tutorials provide additional information for working with grouped data:
How to Find Mean & Standard Deviation of Grouped Data
How to Find the Mode of Grouped Data
How to Find the Median of Grouped Data
Grouped vs. Ungrouped Frequency Distributions


