There are two ways to create a scatterplot using data from a pandas DataFrame:
1. Use pandas.DataFrame.plot.scatter
One way to create a scatterplot is to use the built-in pandas plot.scatter() function:
import pandas as pd

df.plot.scatter(x = 'x_column_name', y = 'y_columnn_name')
2. Use matplotlib.pyplot.scatter
Another way to create a scatterplot is to use the Matplotlib pyplot.scatter() function:
import matplotlib.pyplot as plt

plt.scatter(df.x, df.y)
This tutorial provides an example of how to use each of these methods.
Example 1: Use Pandas
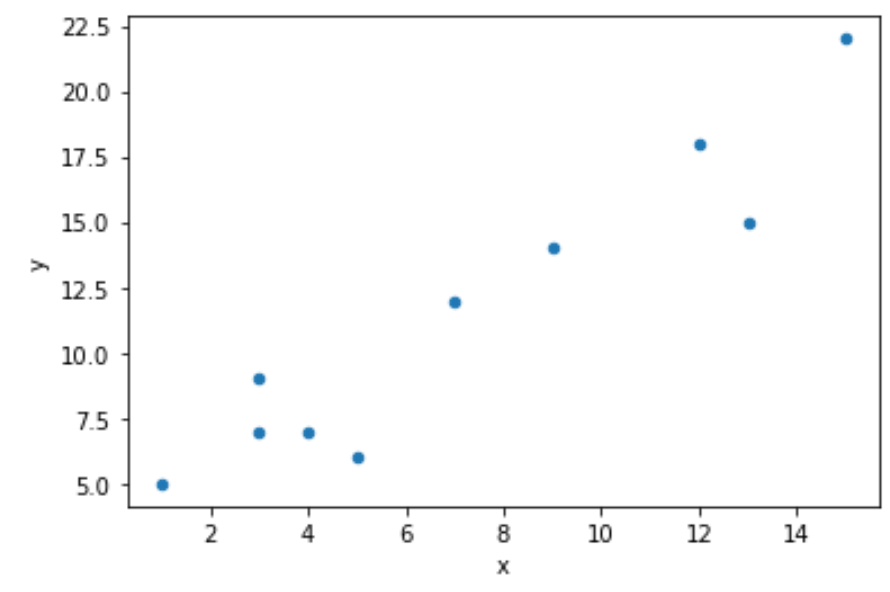
The following code shows how to use the plot.scatter() function to create a simple scatterplot:
import pandas as pd

#create DataFrame
df = pd.DataFrame({'x': [1, 3, 3, 4, 5, 7, 9, 12, 13, 15],
                   'y': [5, 7, 9, 7, 6, 12, 14, 18, 15, 22]})

#create scatterplot
df.plot.scatter(x='x', y='y')
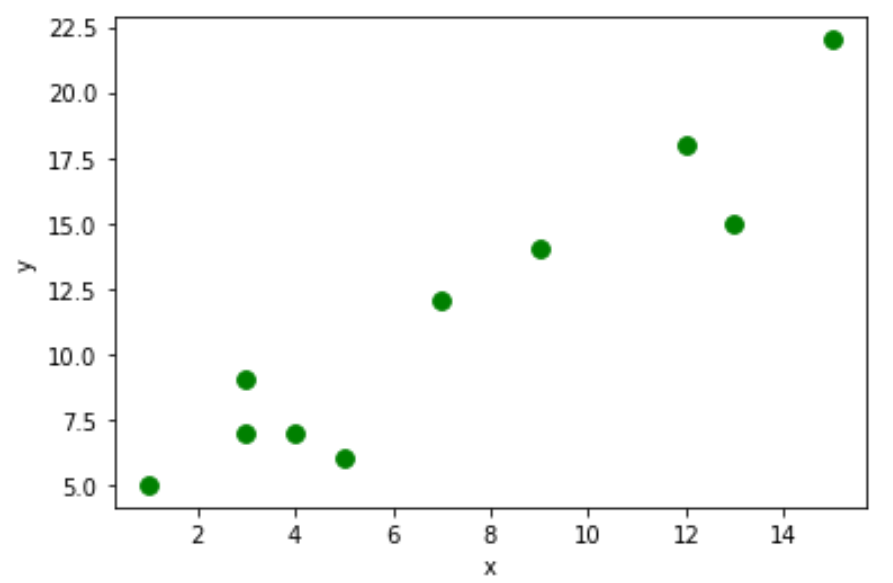
Note that you can use the s and c arguments to modify the size and color of the points, respectively:
df.plot.scatter(x='x', y='y', s=60, c='green')
Example 2: Use Matplotlib
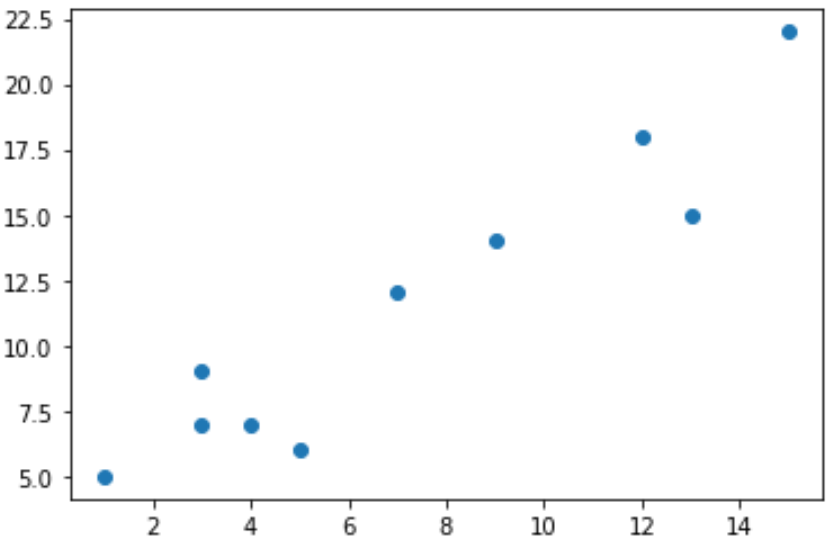
The following code shows how to use the pyplot.scatter() function to create a scatterplot:
import pandas as pd
import matplotlib.pyplot as plt

#create DataFrame
df = pd.DataFrame({'x': [1, 3, 3, 4, 5, 7, 9, 12, 13, 15],
                   'y': [5, 7, 9, 7, 6, 12, 14, 18, 15, 22]})

#create scatterplot
plt.scatter(df.x, df.y)
Note that you can use the s and c arguments to modify the size and color of the points, respectively:
plt.scatter(df.x, df.y, s=60, c='purple')

You can find more Python tutorials here.