A paired samples t-test is used to compare the means of two samples when each observation in one sample can be paired with an observation in the other sample.
This tutorial explains the following:
- The motivation for performing a paired samples t-test.
- The formula to perform a paired samples t-test.
- The assumptions that should be met to perform a paired samples t-test.
- An example of how to perform a paired samples t-test.
Paired Samples t-test: Motivation
A paired samples t-test is commonly used in two scenarios:
1. A measurement is taken on a subject before and after some treatment – e.g. the max vertical jump of college basketball players is measured before and after participating in a training program.
2. A measurement is taken under two different conditions – e.g. the response time of a patient is measured on two different drugs.
In both cases we are interested in comparing the mean measurement between two groups in which each observation in one sample can be paired with an observation in the other sample.
Paired Samples t-test: Formula
A paired samples t-test always uses the following null hypothesis:
- H0: μ1 = μ2 (the two population means are equal)
The alternative hypothesis can be either two-tailed, left-tailed, or right-tailed:
- H1 (two-tailed): μ1 ≠ μ2 (the two population means are not equal)
- H1 (left-tailed): μ1 2 (population 1 mean is less than population 2 mean)
- H1 (right-tailed): μ1> μ2 (population 1 mean is greater than population 2 mean)
We use the following formula to calculate the test statistic t:
t = xdiff / (sdiff/√n)
where:
- xdiff: sample mean of the differences
- s: sample standard deviation of the differences
- n: sample size (i.e. number of pairs)
If the p-value that corresponds to the test statistic t with (n-1) degrees of freedom is less than your chosen significance level (common choices are 0.10, 0.05, and 0.01) then you can reject the null hypothesis.
Paired Samples t-test: Assumptions
For the results of a paired samples t-test to be valid, the following assumptions should be met:
- The participants should be selected randomly from the population.
- The differences between the pairs should be approximately normally distributed.
- There should be no extreme outliers in the differences.
Paired Samples t-test: Example
Suppose we want to know whether or not a certain training program is able to increase the max vertical jump (in inches) of college basketball players.
To test this, we may recruit a simple random sample of 20 college basketball players and measure each of their max vertical jumps. Then, we may have each player use the training program for one month and then measure their max vertical jump again at the end of the month.
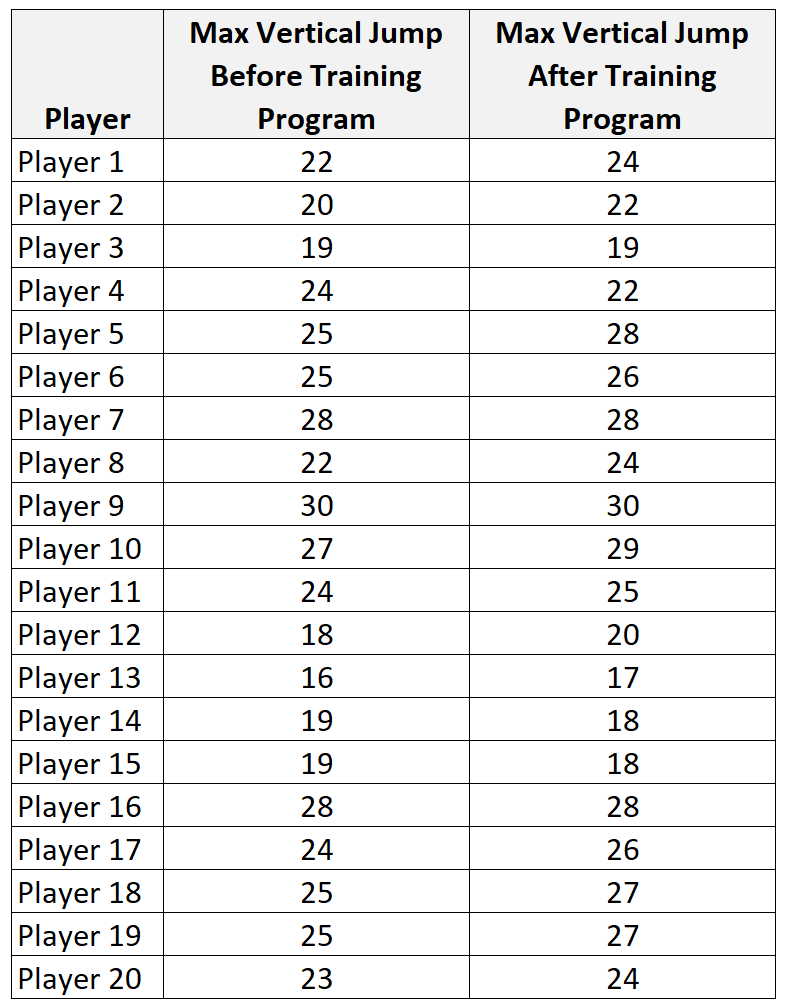
To determine whether or not the training program actually had an effect on max vertical jump, we will perform a paired samples t-test at significance level α = 0.05 using the following steps:
Step 1: Calculate the summary data for the differences.
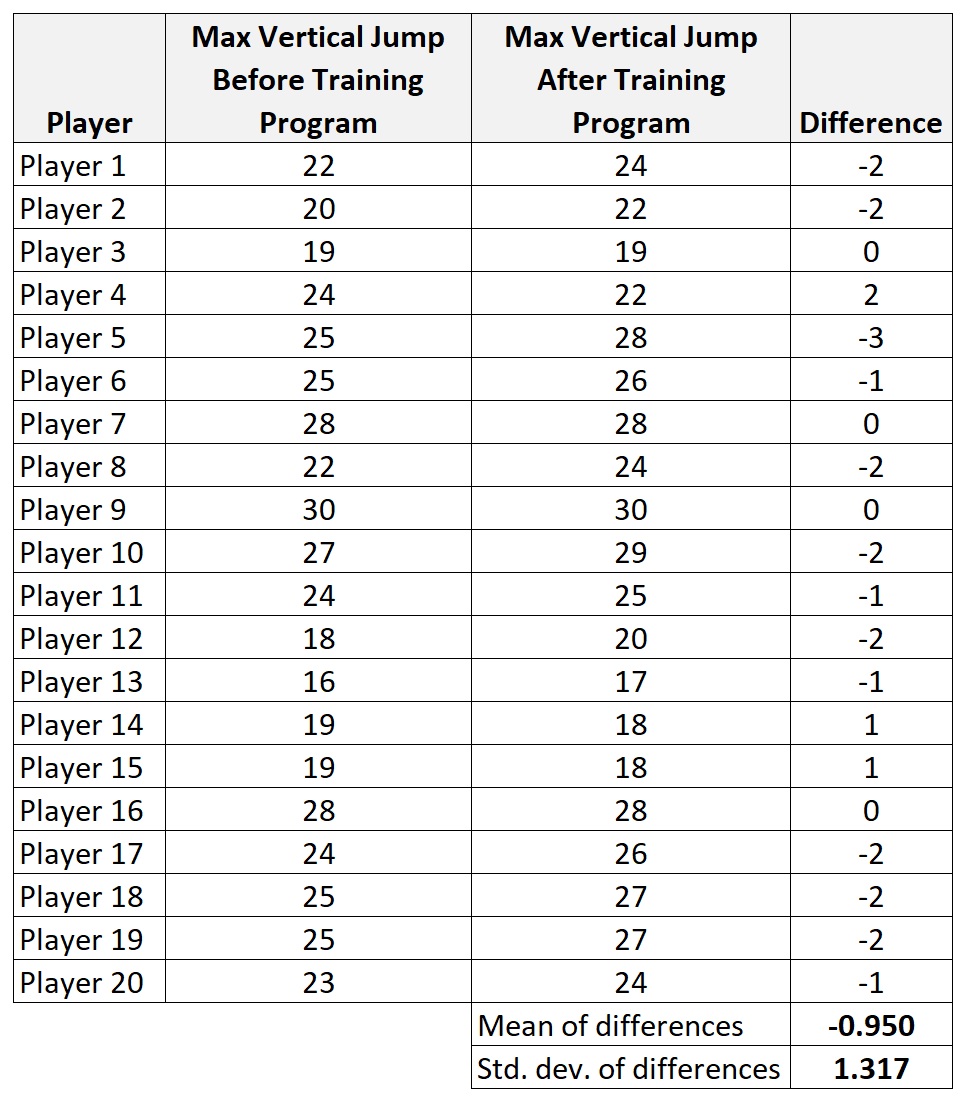
- xdiff: sample mean of the differences = -0.95
- s: sample standard deviation of the differences = 1.317
- n: sample size (i.e. number of pairs) = 20
Step 2: Define the hypotheses.
We will perform the paired samples t-test with the following hypotheses:
- H0: μ1 = μ2 (the two population means are equal)
- H1: μ1 ≠ μ2 (the two population means are not equal)
Step 3: Calculate the test statistic t.
t = xdiff / (sdiff/√n) = -0.95 / (1.317/√20) = -3.226
Step 4: Calculate the p-value of the test statistic t.
According to the T Score to P Value Calculator, the p-value associated with t = -3.226 and degrees of freedom = n-1 = 20-1 = 19 is 0.00445.
Step 5: Draw a conclusion.
Since this p-value is less than our significance level α = 0.05, we reject the null hypothesis. We have sufficient evidence to say that the mean max vertical jump of players is different before and after participating in the training program.
Note: You can also perform this entire paired samples t-test by simply using the Paired Samples t-test Calculator.
Additional Resources
The following tutorials explain how to perform a paired samples t-test using different statistical programs:
How to Perform a Paired Samples t-Test in Excel
How to Perform a Paired Samples t-test in SPSS
How to Perform a Paired Samples t-test in Stata
How to Perform a Paired Samples t-test on a TI-84 Calculator
How to Perform a Paired Samples t-test in R
How to Perform a Paired Samples t-Test in Python
How to Perform a Paired Samples t-Test by Hand