Whenever you conduct a Chi-Square test, you will end up with a Chi-Square test statistic. You can then find the p-value that corresponds to this test statistic to determine whether or not the test results are statistically significant.
To find the p-value that corresponds to a Chi-Square test statistic in Excel, you can use the CHISQ.DIST.RT() function, which uses the following syntax:
=CHISQ.DIST.RT(x, deg_freedom)
where:
- x: The Chi-Square test statistic
- deg_freedom: The degrees of freedom
The following examples show how to use this function in practice.
Example 1: Chi-Square Goodness of Fit Test
A shop owner claims that an equal number of customers come into his shop each weekday. To test this hypothesis, an independent researcher records the number of customers that come into the shop on a given week and finds the following:
- Monday: 50 customers
- Tuesday: 60 customers
- Wednesday: 40 customers
- Thursday: 47 customers
- Friday: 53 customers
After performing a Chi-Square Goodness of Fit test, the researcher finds the following:
Chi-Square Test Statistic (X2): 4.36
Degrees of freedom: (df): 4
To find the p-value associated with this Chi-Square test statistic and degrees of freedom, we can use the following formula in Excel:
=CHISQ.DIST.RT(4.36, 4)
Here’s what that looks like in Excel:
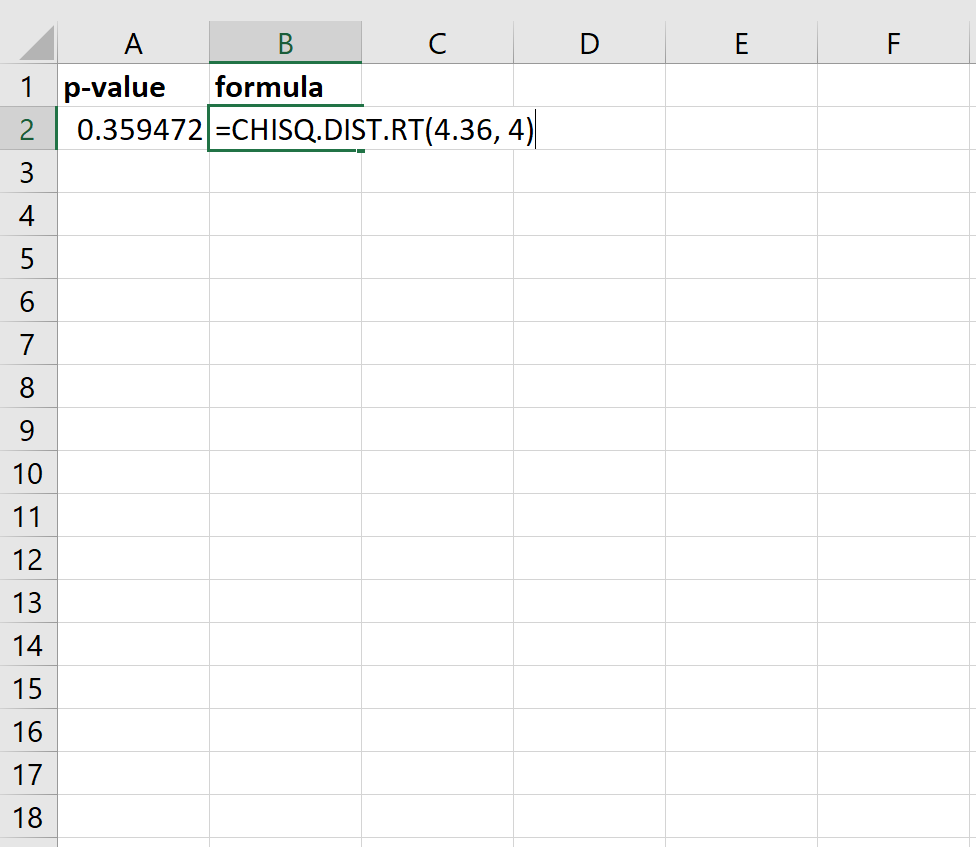
The p-value turns out to be 0.359472. Since this p-value is not less than 0.05, we fail to reject the null hypothesis. This means we do not have sufficient evidence to say that the true distribution of customers is different from the distribution that the shop owner claimed.
Example 2: Chi-Square Test of Independence
Researchers want to know whether or not gender is associated with political party preference. They take a simple random sample of 500 voters and survey them on their political party preference. After performing a Chi-Square Test of Independence, they find the following:
Chi-Square Test Statistic (X2): 0.8642
Degrees of freedom: (df): 2
To find the p-value associated with this Chi-Square test statistic and degrees of freedom, we can use the following code in Excel:
=CHISQ.DIST.RT(0.8642, 2)
Here’s what that looks like in Excel:
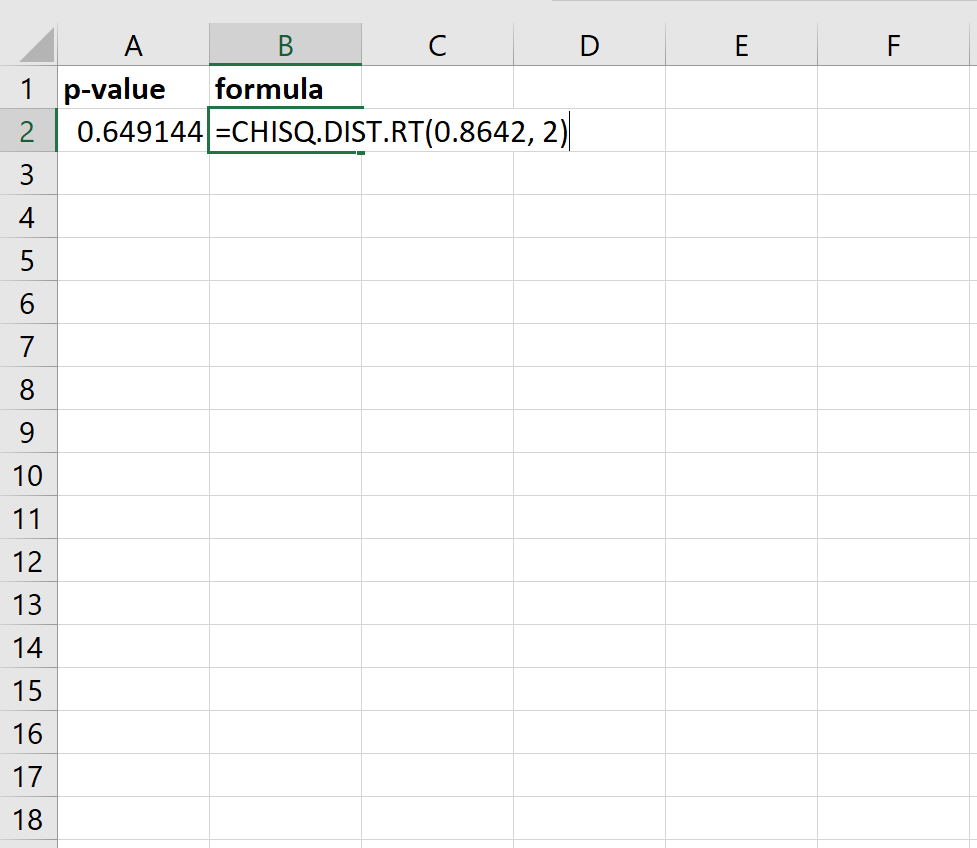
The p-value turns out to be 0.649144. Since this p-value is not less than 0.05, we fail to reject the null hypothesis. This means we do not have sufficient evidence to say that there is an association between gender and political party preference.
You can find more Excel tutorials here.