An outlier is an observation that lies abnormally far away from other values in a dataset.
We often define an observation to be an outlier if it is 1.5 times the interquartile range greater than the third quartile or 1.5 times the interquartile range less than the first quartile.
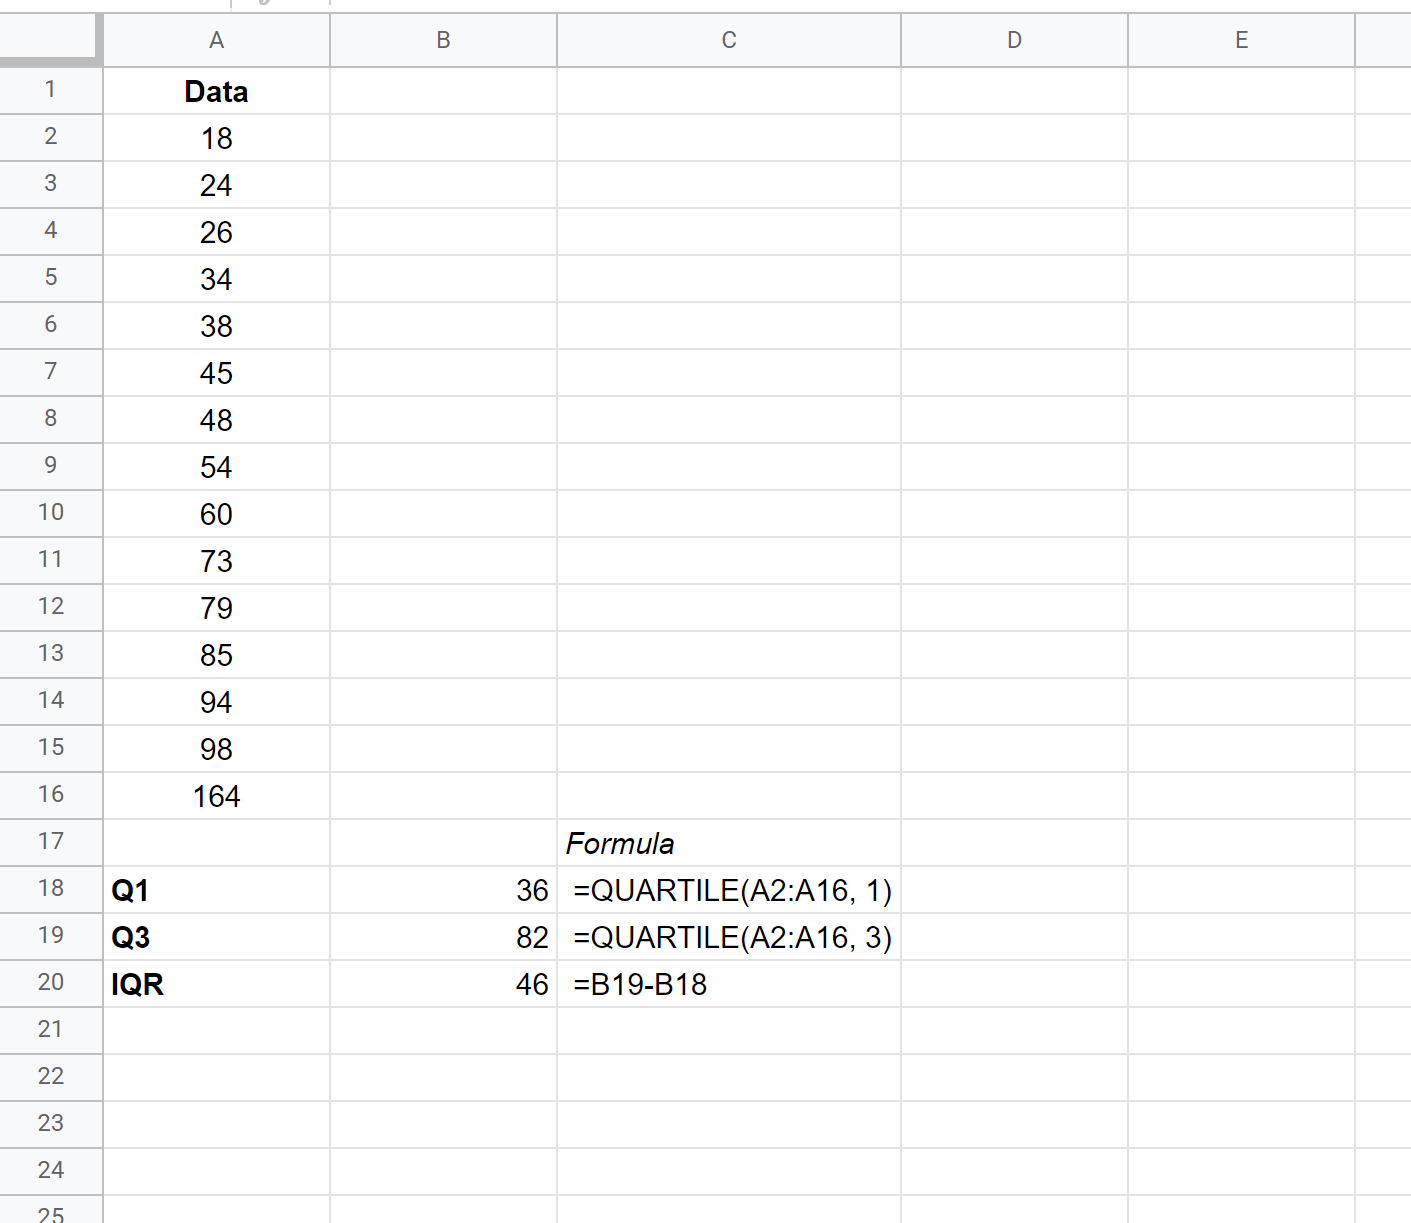
Note: The interquartile range is the difference between the third quartile (75th percentile) and the first quartile (25th percentile) in a dataset. It measures the spread of the middle 50% of values.
The following step-by-step example shows how to use this formula to find outliers in a dataset in Google Sheets.
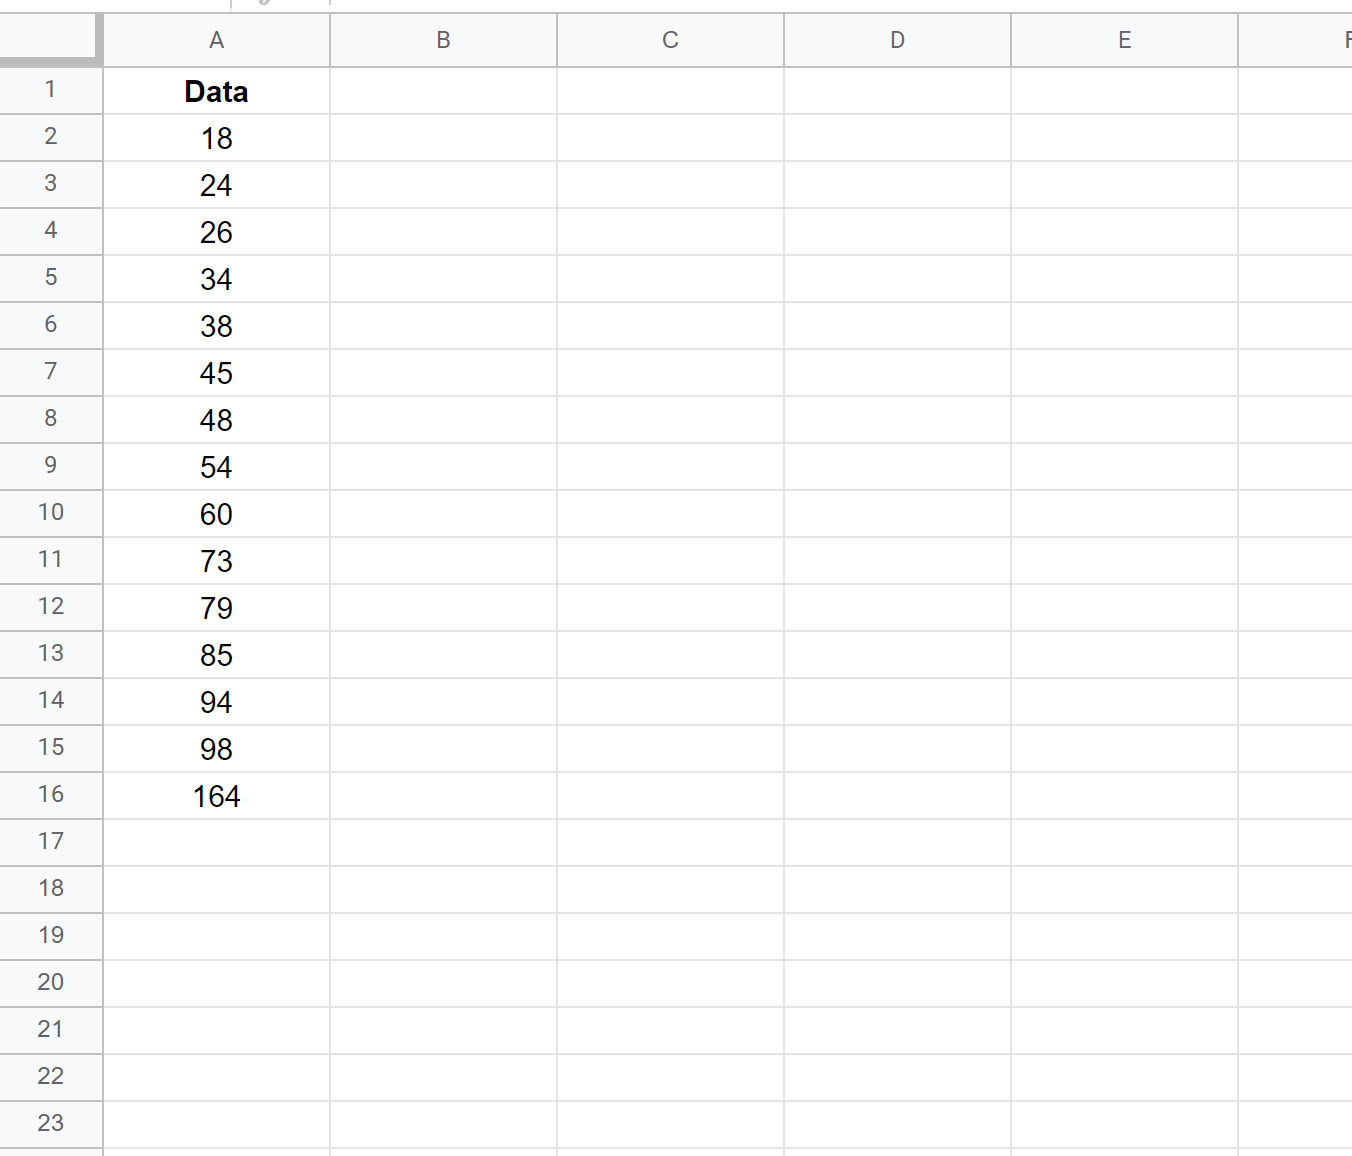
Step 1: Enter the Data
First, let’s enter the values for the following dataset into Google Sheets:
Step 2: Calculate the Interquartile Range
Next, let’s calculate the first quartile, third quartile, and interquartile range of the dataset:
Step 3: Identify Outliers
Next, we can use the following formula to assign a “1” to any value that is an outlier in the dataset:
=IF(A2$B$18-$B$20*1.5, 1, IF(A2>$B$19+$B$20*1.5, 1, 0))
This formula checks to see if an observation is 1.5 times the interquartile range greater than the third quartile or 1.5 times the interquartile range less than the first quartile.
If either is true, the observation is assigned a “1” to designate it as an outlier.
The following screenshot shows how to use this formula in practice:
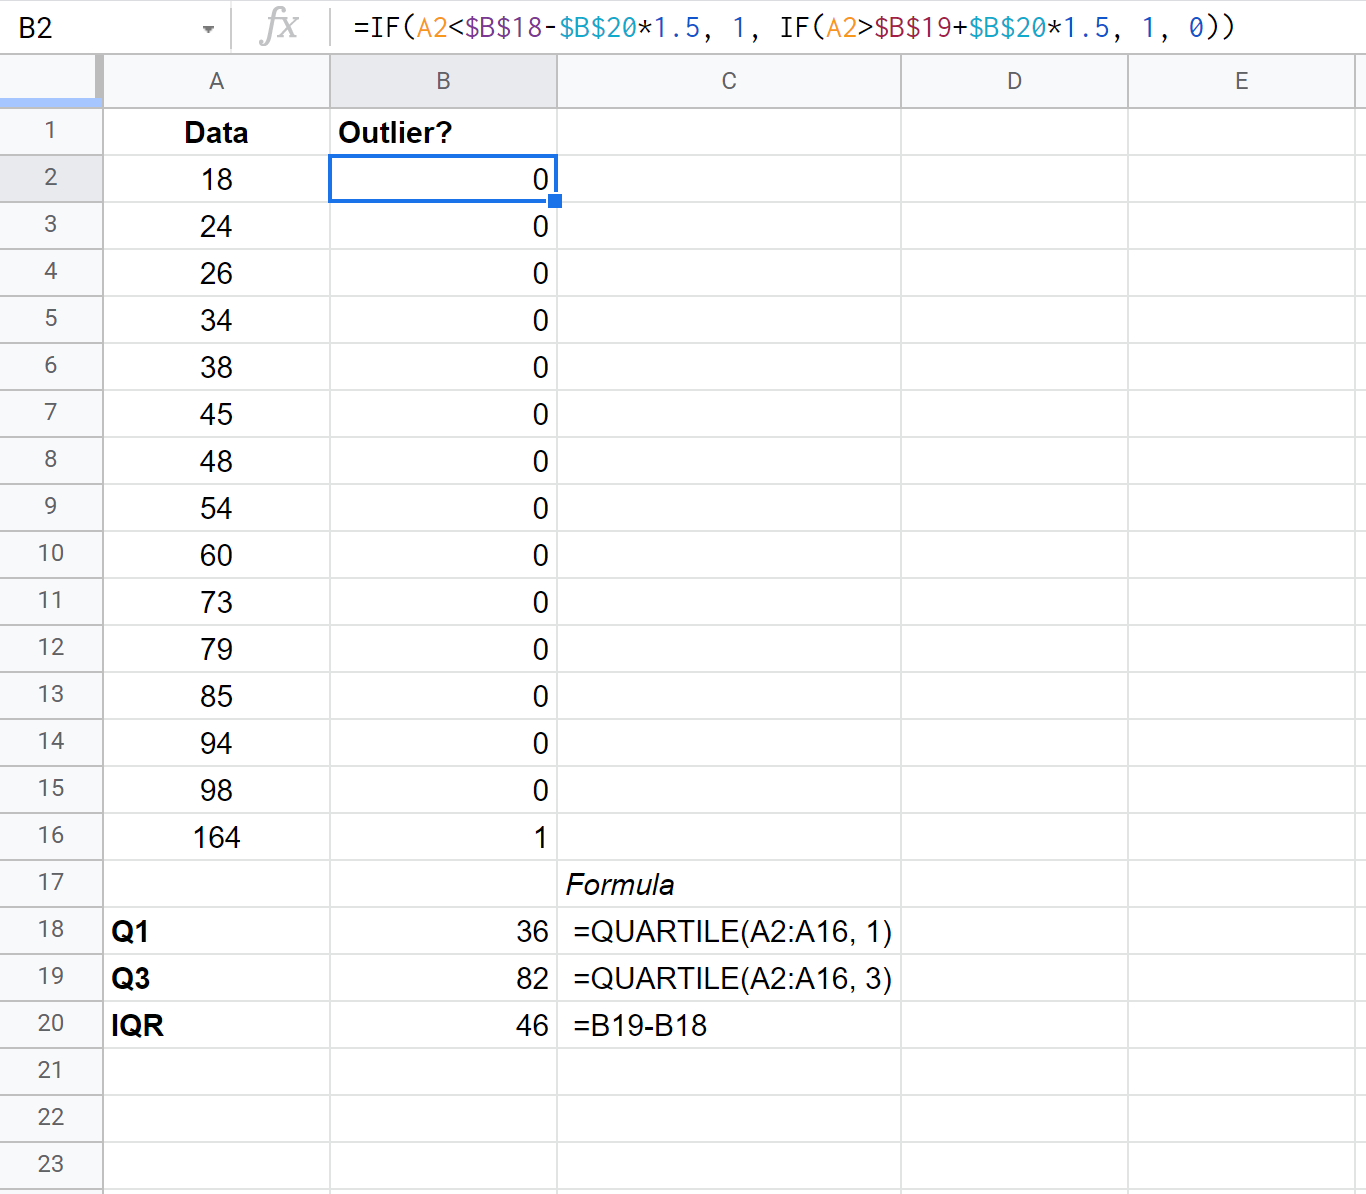
We see that only one value in our dataset turns out to be an outlier: 164.
How to Deal With Outliers
If an outlier is present in your data, you have a few options:
1. Make sure the outlier is not the result of a data entry error.
Sometimes data simple gets recorded incorrectly. If an outlier is present, first check that the value was entered correctly and that it wasn’t an error.
2. Assign a new value to the outlier.
If the outlier is the result of a data entry error, you may decide to assign a new value to it such as the mean or the median of the dataset.
3. Remove the outlier.
If the value is a true outlier, you may choose to remove it if it will have a significant impact on your overall analysis. Just make sure to mention in your final report that you removed an outlier.
Additional Resources
The following tutorials explain how to remove outliers in other statistical software:
How to Remove Outliers in R
How to Remove Outliers in Python
How to Remove Outliers in SPSS