By default, ggplot2 orders the bars in a bar chart using the following orders:
- Factor variables are ordered by factor levels.
- Character variables are order in alphabetical order.
However, often you may be interested in ordering the bars in some other specific order.
This tutorial explains how to do so using the following data frame:
#create data frame
df frame(team = c('B', 'B', 'B', 'A', 'A', 'C'),
                 points = c(12, 28, 19, 22, 32, 45),
                 rebounds = c(5, 7, 7, 12, 11, 4))

#view structure of data frame
str(df)

'data.frame':	6 obs. of  3 variables:
 $ team    : Factor w/ 3 levels "A","B","C": 2 2 2 1 1 3
 $ points  : num  12 28 19 22 32 45
 $ rebounds: num  5 7 7 12 11 4
Example 1: Order the Bars Based on a Specific Factor Order
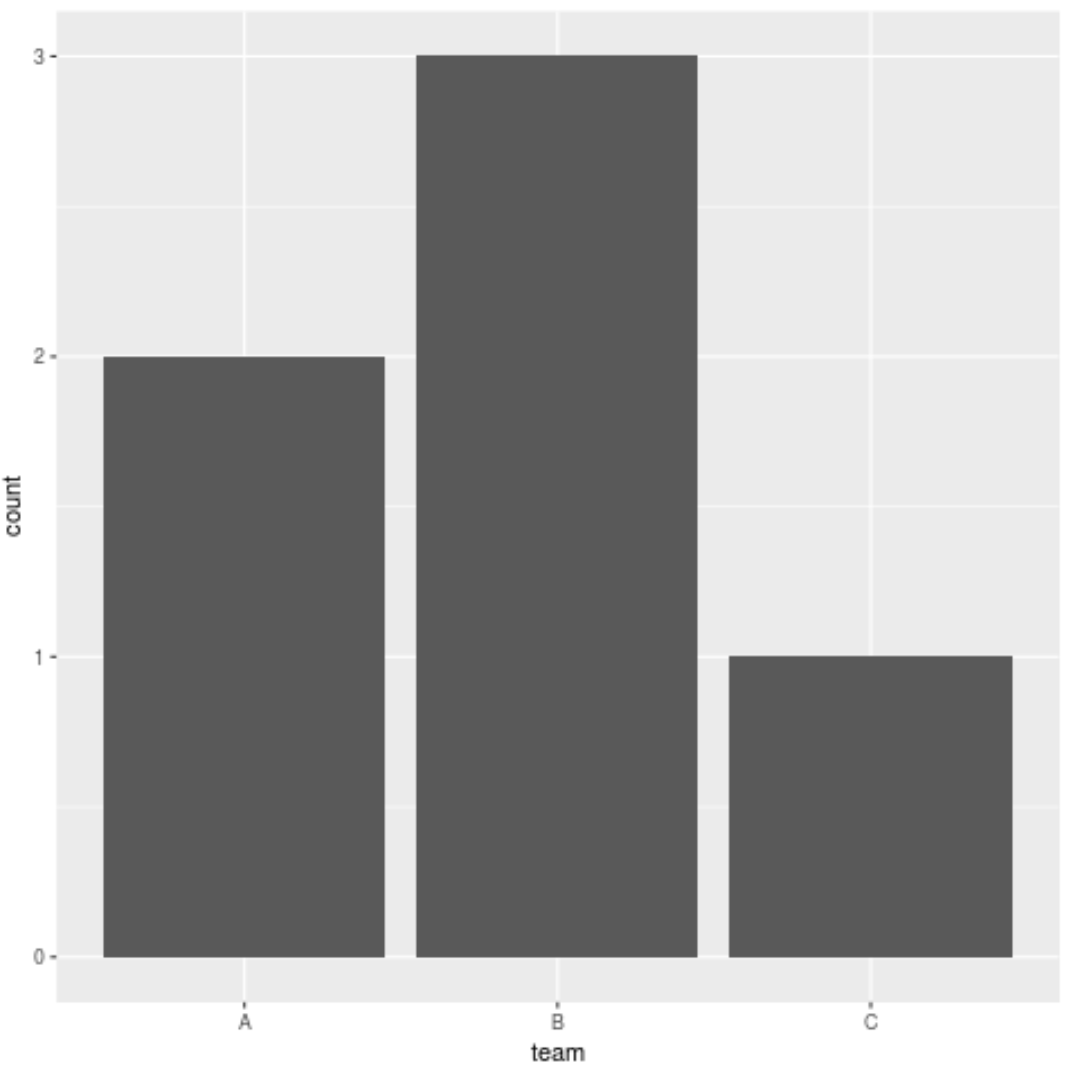
If we attempt to create a bar chart to display the frequency by team, the bars will automatically appear in alphabetical order:
library(ggplot2)

ggplot(df, aes(x=team)) +
  geom_bar()
The following code shows how to order the bars by a specific order:
#specify factor level order
df$team = factor(df$team, levels = c('C', 'A', 'B'))

#create bar chart again
ggplot(df, aes(x=team)) +
  geom_bar()
Example 2: Order the Bars Based on Numerical Value
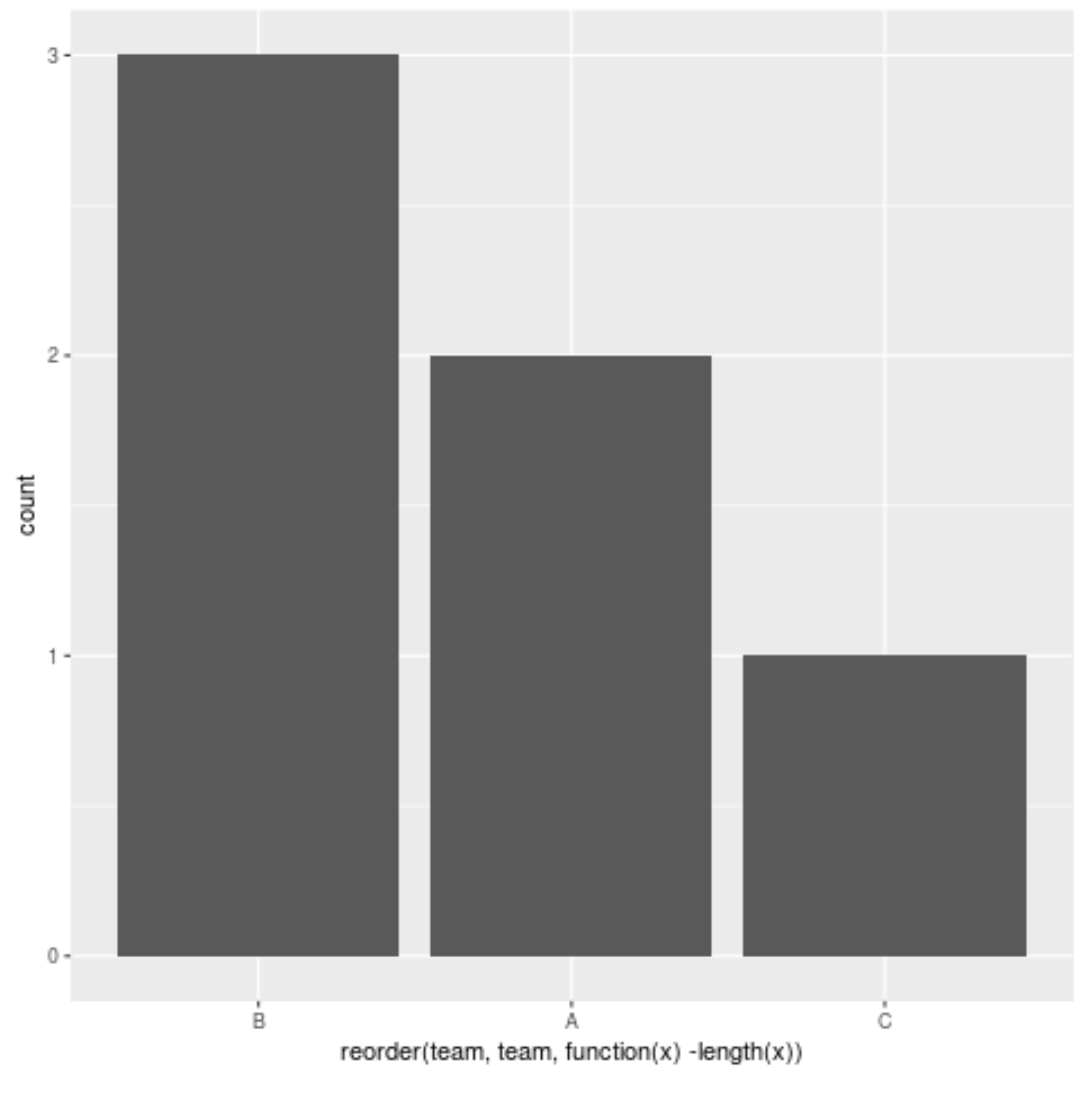
We can also order the bars based on numerical values. For example, the following code shows how to order the bars from largest to smallest frequency using the reorder() function:
library(ggplot2)

ggplot(df, aes(x=reorder(team, team, function(x)-length(x)))) +
  geom_bar()
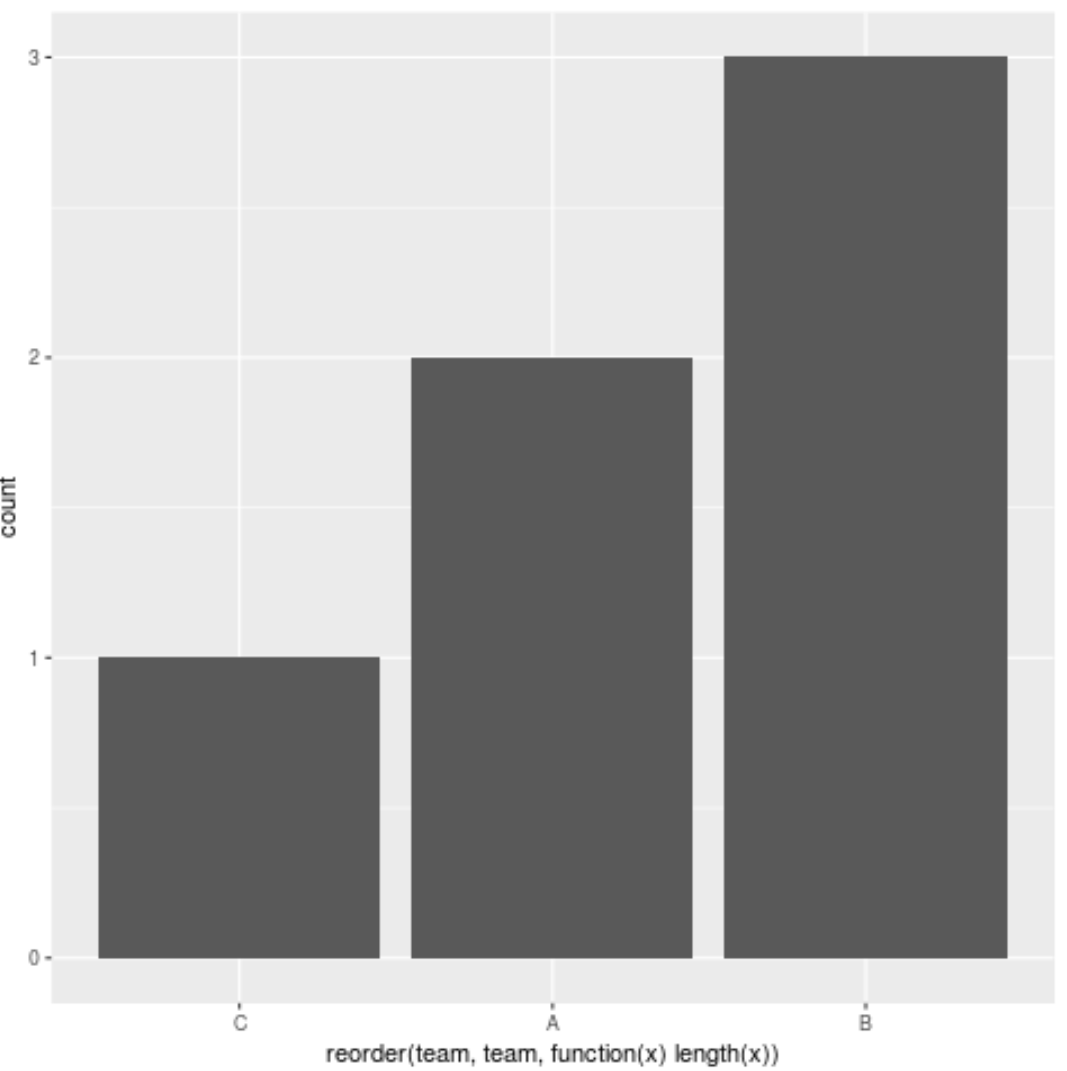
We can also order the bars from smallest to largest frequency by taking out the minus sign in the function() call within reorder() function:
library(ggplot2)

ggplot(df, aes(x=reorder(team, team, function(x) length(x)))) +
  geom_bar()
Additional Resources
Documentation for the geom_bar() function.
Documentation for the reorder() function.
A complete list of R tutorials on Statology.